Immigrants from Kuwait vs Estonian Single Male Poverty
COMPARE
Immigrants from Kuwait
Estonian
Single Male Poverty
Single Male Poverty Comparison
Immigrants from Kuwait
Estonians
12.9%
SINGLE MALE POVERTY
31.9/ 100
METRIC RATING
187th/ 347
METRIC RANK
13.0%
SINGLE MALE POVERTY
20.3/ 100
METRIC RATING
204th/ 347
METRIC RANK
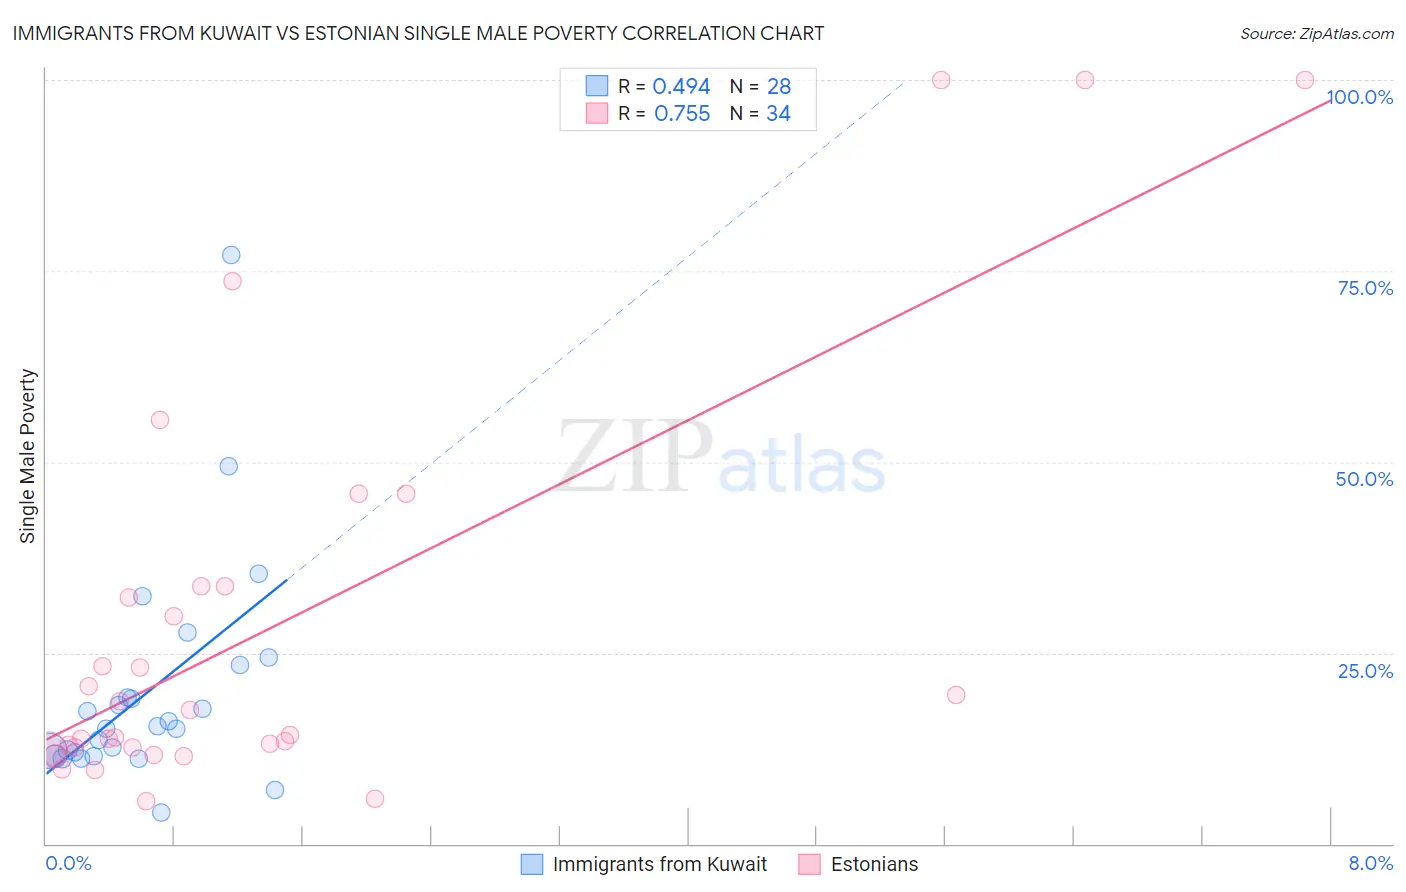
Immigrants from Kuwait vs Estonian Single Male Poverty Correlation Chart
The statistical analysis conducted on geographies consisting of 129,103,469 people shows a moderate positive correlation between the proportion of Immigrants from Kuwait and poverty level among single males in the United States with a correlation coefficient (R) of 0.494 and weighted average of 12.9%. Similarly, the statistical analysis conducted on geographies consisting of 115,524,258 people shows a strong positive correlation between the proportion of Estonians and poverty level among single males in the United States with a correlation coefficient (R) of 0.755 and weighted average of 13.0%, a difference of 0.79%.
Single Male Poverty Correlation Summary
| Measurement | Immigrants from Kuwait | Estonian |
| Minimum | 4.1% | 5.6% |
| Maximum | 77.0% | 100.0% |
| Range | 73.0% | 94.4% |
| Mean | 19.7% | 28.6% |
| Median | 15.2% | 15.9% |
| Interquartile 25% (IQ1) | 11.7% | 12.6% |
| Interquartile 75% (IQ3) | 21.3% | 33.7% |
| Interquartile Range (IQR) | 9.6% | 21.1% |
| Standard Deviation (Sample) | 14.6% | 27.0% |
| Standard Deviation (Population) | 14.4% | 26.6% |
Demographics Similar to Immigrants from Kuwait and Estonians by Single Male Poverty
In terms of single male poverty, the demographic groups most similar to Immigrants from Kuwait are Nigerian (12.9%, a difference of 0.0%), Norwegian (12.9%, a difference of 0.010%), Macedonian (12.9%, a difference of 0.020%), Portuguese (12.9%, a difference of 0.10%), and Arab (13.0%, a difference of 0.31%). Similarly, the demographic groups most similar to Estonians are Immigrants from Bangladesh (13.0%, a difference of 0.0%), Basque (13.0%, a difference of 0.030%), Polish (13.0%, a difference of 0.080%), Trinidadian and Tobagonian (13.0%, a difference of 0.090%), and Slovene (13.0%, a difference of 0.10%).
| Demographics | Rating | Rank | Single Male Poverty |
| Norwegians | 32.0 /100 | #185 | Fair 12.9% |
| Nigerians | 31.9 /100 | #186 | Fair 12.9% |
| Immigrants | Kuwait | 31.9 /100 | #187 | Fair 12.9% |
| Macedonians | 31.5 /100 | #188 | Fair 12.9% |
| Portuguese | 30.2 /100 | #189 | Fair 12.9% |
| Arabs | 27.0 /100 | #190 | Fair 13.0% |
| Immigrants | Thailand | 26.6 /100 | #191 | Fair 13.0% |
| Immigrants | Jamaica | 26.5 /100 | #192 | Fair 13.0% |
| Immigrants | South Africa | 26.1 /100 | #193 | Fair 13.0% |
| Liberians | 25.2 /100 | #194 | Fair 13.0% |
| Immigrants | England | 23.4 /100 | #195 | Fair 13.0% |
| Immigrants | Grenada | 23.1 /100 | #196 | Fair 13.0% |
| Immigrants | Laos | 23.1 /100 | #197 | Fair 13.0% |
| Lithuanians | 22.1 /100 | #198 | Fair 13.0% |
| Immigrants | Norway | 21.8 /100 | #199 | Fair 13.0% |
| Slovenes | 21.6 /100 | #200 | Fair 13.0% |
| Trinidadians and Tobagonians | 21.4 /100 | #201 | Fair 13.0% |
| Basques | 20.7 /100 | #202 | Fair 13.0% |
| Immigrants | Bangladesh | 20.4 /100 | #203 | Fair 13.0% |
| Estonians | 20.3 /100 | #204 | Fair 13.0% |
| Poles | 19.3 /100 | #205 | Poor 13.0% |