Immigrants from Western Asia vs Estonian Single Male Poverty
COMPARE
Immigrants from Western Asia
Estonian
Single Male Poverty
Single Male Poverty Comparison
Immigrants from Western Asia
Estonians
12.5%
SINGLE MALE POVERTY
83.4/ 100
METRIC RATING
133rd/ 347
METRIC RANK
13.0%
SINGLE MALE POVERTY
20.3/ 100
METRIC RATING
204th/ 347
METRIC RANK
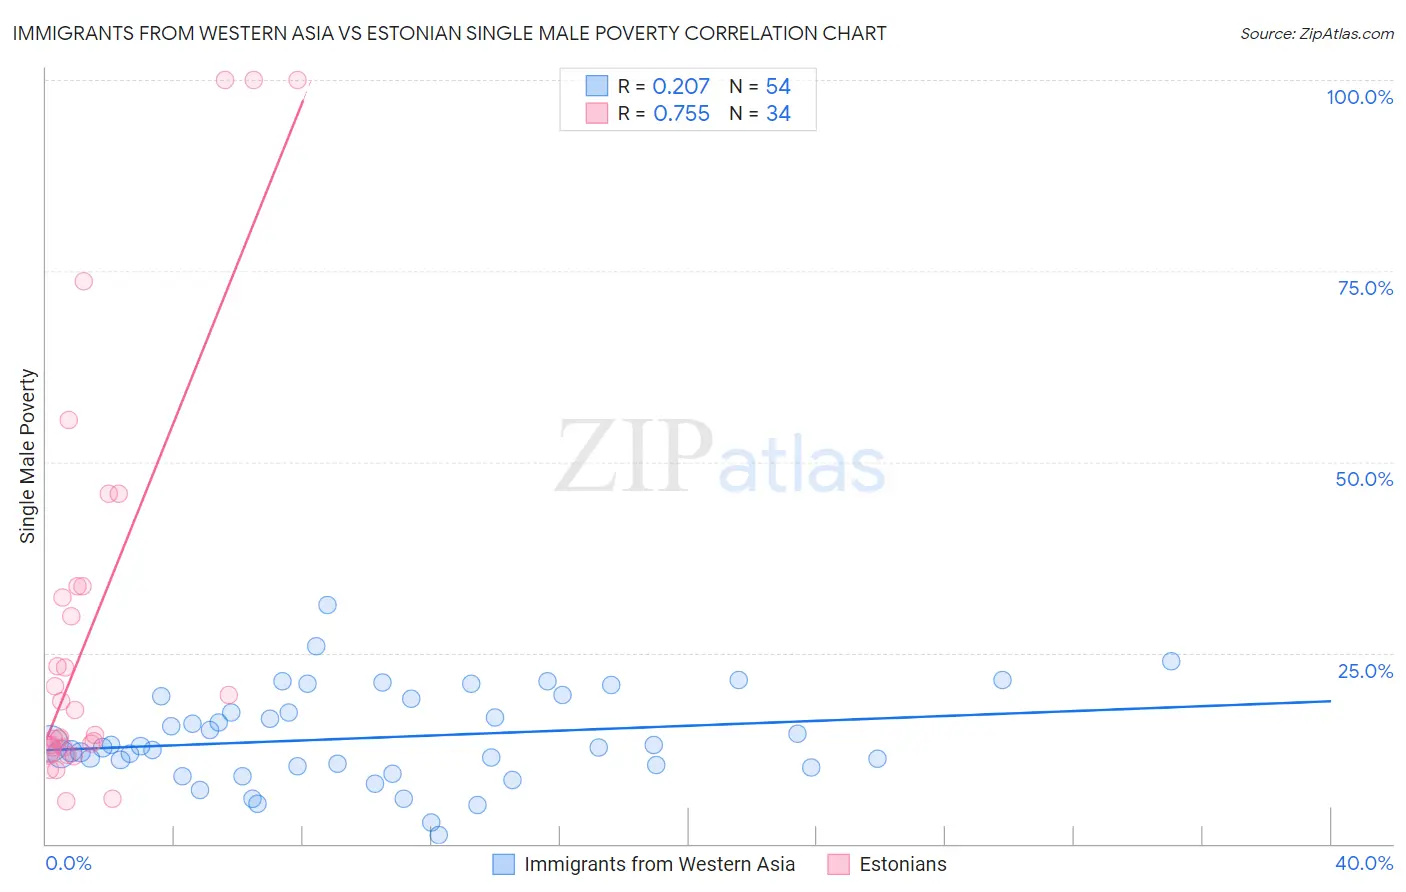
Immigrants from Western Asia vs Estonian Single Male Poverty Correlation Chart
The statistical analysis conducted on geographies consisting of 356,365,100 people shows a weak positive correlation between the proportion of Immigrants from Western Asia and poverty level among single males in the United States with a correlation coefficient (R) of 0.207 and weighted average of 12.5%. Similarly, the statistical analysis conducted on geographies consisting of 115,524,258 people shows a strong positive correlation between the proportion of Estonians and poverty level among single males in the United States with a correlation coefficient (R) of 0.755 and weighted average of 13.0%, a difference of 4.0%.
Single Male Poverty Correlation Summary
| Measurement | Immigrants from Western Asia | Estonian |
| Minimum | 1.2% | 5.6% |
| Maximum | 31.2% | 100.0% |
| Range | 30.1% | 94.4% |
| Mean | 13.9% | 28.6% |
| Median | 12.7% | 15.9% |
| Interquartile 25% (IQ1) | 10.2% | 12.6% |
| Interquartile 75% (IQ3) | 19.0% | 33.7% |
| Interquartile Range (IQR) | 8.8% | 21.1% |
| Standard Deviation (Sample) | 6.1% | 27.0% |
| Standard Deviation (Population) | 6.0% | 26.6% |
Similar Demographics by Single Male Poverty
Demographics Similar to Immigrants from Western Asia by Single Male Poverty
In terms of single male poverty, the demographic groups most similar to Immigrants from Western Asia are Immigrants from Northern Europe (12.5%, a difference of 0.030%), Salvadoran (12.5%, a difference of 0.030%), Immigrants from Ecuador (12.5%, a difference of 0.12%), Immigrants from Nicaragua (12.5%, a difference of 0.14%), and Immigrants from Costa Rica (12.5%, a difference of 0.14%).
| Demographics | Rating | Rank | Single Male Poverty |
| Romanians | 86.4 /100 | #126 | Excellent 12.5% |
| Immigrants | Netherlands | 86.2 /100 | #127 | Excellent 12.5% |
| Ecuadorians | 85.9 /100 | #128 | Excellent 12.5% |
| Immigrants | Sierra Leone | 85.5 /100 | #129 | Excellent 12.5% |
| Immigrants | Nicaragua | 84.8 /100 | #130 | Excellent 12.5% |
| Immigrants | Northern Europe | 83.7 /100 | #131 | Excellent 12.5% |
| Salvadorans | 83.7 /100 | #132 | Excellent 12.5% |
| Immigrants | Western Asia | 83.4 /100 | #133 | Excellent 12.5% |
| Immigrants | Ecuador | 82.1 /100 | #134 | Excellent 12.5% |
| Immigrants | Costa Rica | 81.9 /100 | #135 | Excellent 12.5% |
| Immigrants | Austria | 81.9 /100 | #136 | Excellent 12.5% |
| Ukrainians | 80.7 /100 | #137 | Excellent 12.6% |
| Immigrants | El Salvador | 80.0 /100 | #138 | Excellent 12.6% |
| Cubans | 79.9 /100 | #139 | Good 12.6% |
| Immigrants | Zimbabwe | 78.0 /100 | #140 | Good 12.6% |
Demographics Similar to Estonians by Single Male Poverty
In terms of single male poverty, the demographic groups most similar to Estonians are Immigrants from Bangladesh (13.0%, a difference of 0.0%), Basque (13.0%, a difference of 0.030%), Polish (13.0%, a difference of 0.080%), Trinidadian and Tobagonian (13.0%, a difference of 0.090%), and Slovene (13.0%, a difference of 0.10%).
| Demographics | Rating | Rank | Single Male Poverty |
| Immigrants | Laos | 23.1 /100 | #197 | Fair 13.0% |
| Lithuanians | 22.1 /100 | #198 | Fair 13.0% |
| Immigrants | Norway | 21.8 /100 | #199 | Fair 13.0% |
| Slovenes | 21.6 /100 | #200 | Fair 13.0% |
| Trinidadians and Tobagonians | 21.4 /100 | #201 | Fair 13.0% |
| Basques | 20.7 /100 | #202 | Fair 13.0% |
| Immigrants | Bangladesh | 20.4 /100 | #203 | Fair 13.0% |
| Estonians | 20.3 /100 | #204 | Fair 13.0% |
| Poles | 19.3 /100 | #205 | Poor 13.0% |
| Northern Europeans | 18.9 /100 | #206 | Poor 13.0% |
| Sudanese | 17.7 /100 | #207 | Poor 13.1% |
| Immigrants | Western Africa | 17.6 /100 | #208 | Poor 13.1% |
| Mexican American Indians | 17.5 /100 | #209 | Poor 13.1% |
| Immigrants | Haiti | 16.8 /100 | #210 | Poor 13.1% |
| Swedes | 16.8 /100 | #211 | Poor 13.1% |