Choctaw vs Mexican Single Male Poverty
COMPARE
Choctaw
Mexican
Single Male Poverty
Single Male Poverty Comparison
Choctaw
Mexicans
17.0%
SINGLE MALE POVERTY
0.0/ 100
METRIC RATING
325th/ 347
METRIC RANK
14.0%
SINGLE MALE POVERTY
0.1/ 100
METRIC RATING
272nd/ 347
METRIC RANK
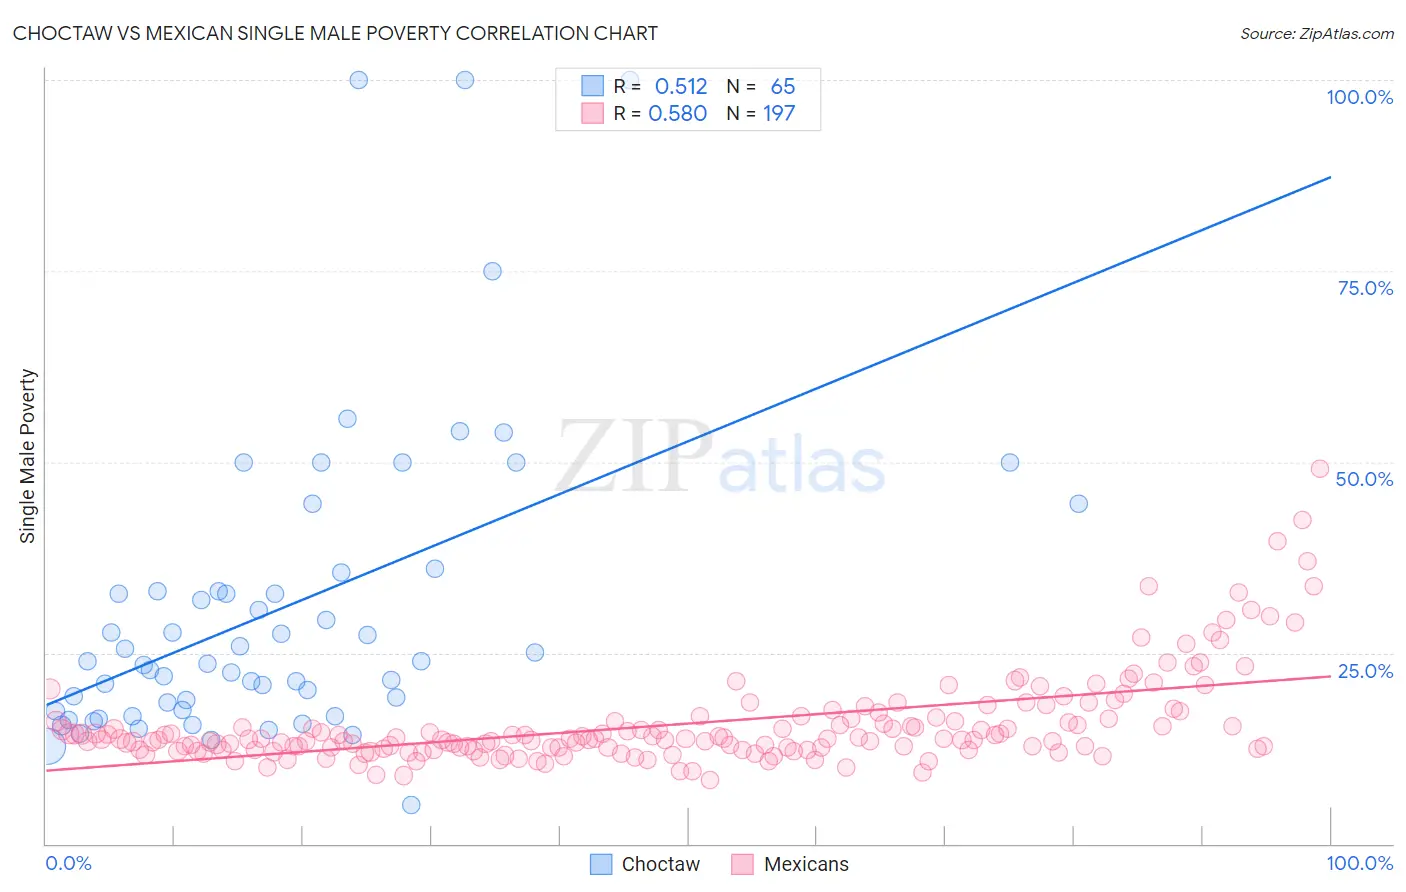
Choctaw vs Mexican Single Male Poverty Correlation Chart
The statistical analysis conducted on geographies consisting of 249,568,106 people shows a substantial positive correlation between the proportion of Choctaw and poverty level among single males in the United States with a correlation coefficient (R) of 0.512 and weighted average of 17.0%. Similarly, the statistical analysis conducted on geographies consisting of 471,672,286 people shows a substantial positive correlation between the proportion of Mexicans and poverty level among single males in the United States with a correlation coefficient (R) of 0.580 and weighted average of 14.0%, a difference of 21.4%.
Single Male Poverty Correlation Summary
| Measurement | Choctaw | Mexican |
| Minimum | 5.0% | 8.4% |
| Maximum | 100.0% | 49.1% |
| Range | 95.0% | 40.7% |
| Mean | 30.9% | 15.6% |
| Median | 23.9% | 13.7% |
| Interquartile 25% (IQ1) | 17.5% | 12.3% |
| Interquartile 75% (IQ3) | 34.3% | 16.2% |
| Interquartile Range (IQR) | 16.8% | 3.9% |
| Standard Deviation (Sample) | 20.3% | 6.1% |
| Standard Deviation (Population) | 20.1% | 6.1% |
Similar Demographics by Single Male Poverty
Demographics Similar to Choctaw by Single Male Poverty
In terms of single male poverty, the demographic groups most similar to Choctaw are Immigrants from Yemen (16.9%, a difference of 0.72%), Creek (16.8%, a difference of 0.83%), Central American Indian (17.2%, a difference of 1.6%), Shoshone (16.7%, a difference of 1.9%), and Osage (16.5%, a difference of 3.1%).
| Demographics | Rating | Rank | Single Male Poverty |
| Chickasaw | 0.0 /100 | #318 | Tragic 16.3% |
| Chippewa | 0.0 /100 | #319 | Tragic 16.4% |
| Marshallese | 0.0 /100 | #320 | Tragic 16.4% |
| Osage | 0.0 /100 | #321 | Tragic 16.5% |
| Shoshone | 0.0 /100 | #322 | Tragic 16.7% |
| Creek | 0.0 /100 | #323 | Tragic 16.8% |
| Immigrants | Yemen | 0.0 /100 | #324 | Tragic 16.9% |
| Choctaw | 0.0 /100 | #325 | Tragic 17.0% |
| Central American Indians | 0.0 /100 | #326 | Tragic 17.2% |
| Menominee | 0.0 /100 | #327 | Tragic 17.7% |
| Kiowa | 0.0 /100 | #328 | Tragic 18.3% |
| Colville | 0.0 /100 | #329 | Tragic 18.4% |
| Cajuns | 0.0 /100 | #330 | Tragic 19.1% |
| Paiute | 0.0 /100 | #331 | Tragic 19.3% |
| Natives/Alaskans | 0.0 /100 | #332 | Tragic 19.6% |
Demographics Similar to Mexicans by Single Male Poverty
In terms of single male poverty, the demographic groups most similar to Mexicans are Irish (14.0%, a difference of 0.060%), Immigrants from Saudi Arabia (14.0%, a difference of 0.090%), Scottish (14.0%, a difference of 0.10%), Immigrants from Mexico (13.9%, a difference of 0.26%), and German (13.9%, a difference of 0.33%).
| Demographics | Rating | Rank | Single Male Poverty |
| Immigrants | Congo | 0.2 /100 | #265 | Tragic 13.9% |
| Immigrants | Cabo Verde | 0.1 /100 | #266 | Tragic 13.9% |
| Germans | 0.1 /100 | #267 | Tragic 13.9% |
| Immigrants | Mexico | 0.1 /100 | #268 | Tragic 13.9% |
| Scottish | 0.1 /100 | #269 | Tragic 14.0% |
| Immigrants | Saudi Arabia | 0.1 /100 | #270 | Tragic 14.0% |
| Irish | 0.1 /100 | #271 | Tragic 14.0% |
| Mexicans | 0.1 /100 | #272 | Tragic 14.0% |
| Welsh | 0.1 /100 | #273 | Tragic 14.0% |
| Hondurans | 0.1 /100 | #274 | Tragic 14.0% |
| English | 0.1 /100 | #275 | Tragic 14.1% |
| Dutch | 0.1 /100 | #276 | Tragic 14.1% |
| Immigrants | Honduras | 0.0 /100 | #277 | Tragic 14.1% |
| Slovaks | 0.0 /100 | #278 | Tragic 14.1% |
| Indonesians | 0.0 /100 | #279 | Tragic 14.1% |