Chippewa vs Lithuanian Kindergarten
COMPARE
Chippewa
Lithuanian
Kindergarten
Kindergarten Comparison
Chippewa
Lithuanians
98.5%
KINDERGARTEN
99.9/ 100
METRIC RATING
39th/ 347
METRIC RANK
98.6%
KINDERGARTEN
100.0/ 100
METRIC RATING
21st/ 347
METRIC RANK
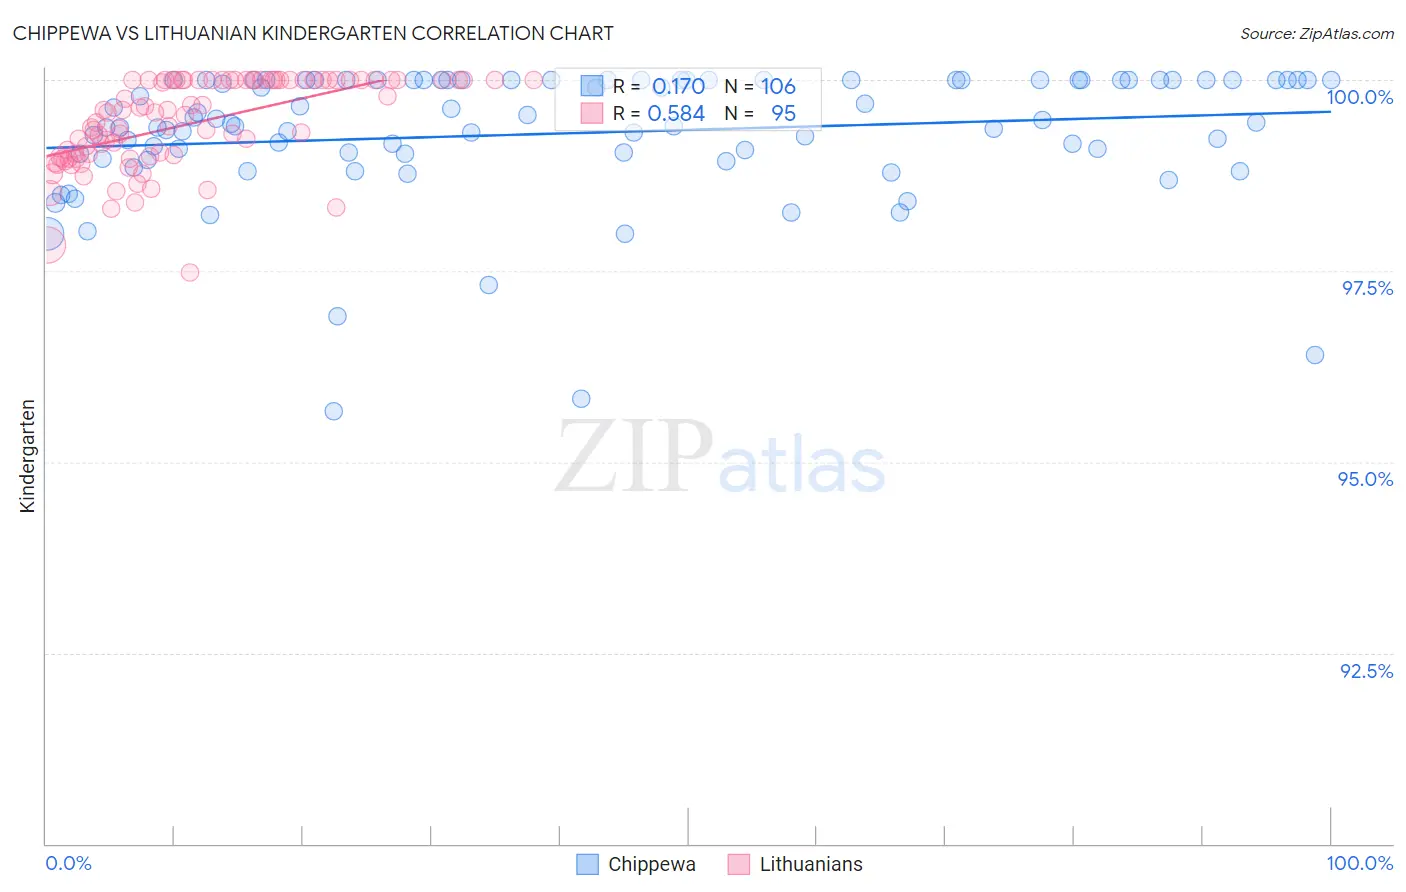
Chippewa vs Lithuanian Kindergarten Correlation Chart
The statistical analysis conducted on geographies consisting of 215,065,644 people shows a poor positive correlation between the proportion of Chippewa and percentage of population with at least kindergarten education in the United States with a correlation coefficient (R) of 0.170 and weighted average of 98.5%. Similarly, the statistical analysis conducted on geographies consisting of 421,946,231 people shows a substantial positive correlation between the proportion of Lithuanians and percentage of population with at least kindergarten education in the United States with a correlation coefficient (R) of 0.584 and weighted average of 98.6%, a difference of 0.11%.
Kindergarten Correlation Summary
| Measurement | Chippewa | Lithuanian |
| Minimum | 95.7% | 97.5% |
| Maximum | 100.0% | 100.0% |
| Range | 4.3% | 2.5% |
| Mean | 99.3% | 99.4% |
| Median | 99.4% | 99.6% |
| Interquartile 25% (IQ1) | 99.0% | 99.0% |
| Interquartile 75% (IQ3) | 100.0% | 100.0% |
| Interquartile Range (IQR) | 0.97% | 1.0% |
| Standard Deviation (Sample) | 0.87% | 0.58% |
| Standard Deviation (Population) | 0.86% | 0.58% |
Demographics Similar to Chippewa and Lithuanians by Kindergarten
In terms of kindergarten, the demographic groups most similar to Chippewa are Latvian (98.5%, a difference of 0.0%), Italian (98.5%, a difference of 0.010%), Luxembourger (98.5%, a difference of 0.010%), British (98.5%, a difference of 0.030%), and Chinese (98.5%, a difference of 0.050%). Similarly, the demographic groups most similar to Lithuanians are Pennsylvania German (98.6%, a difference of 0.0%), Finnish (98.6%, a difference of 0.0%), Arapaho (98.6%, a difference of 0.0%), Danish (98.6%, a difference of 0.0%), and Sioux (98.6%, a difference of 0.0%).
| Demographics | Rating | Rank | Kindergarten |
| Pennsylvania Germans | 100.0 /100 | #20 | Exceptional 98.6% |
| Lithuanians | 100.0 /100 | #21 | Exceptional 98.6% |
| Finns | 100.0 /100 | #22 | Exceptional 98.6% |
| Arapaho | 100.0 /100 | #23 | Exceptional 98.6% |
| Danes | 100.0 /100 | #24 | Exceptional 98.6% |
| Sioux | 100.0 /100 | #25 | Exceptional 98.6% |
| Poles | 100.0 /100 | #26 | Exceptional 98.6% |
| Scotch-Irish | 100.0 /100 | #27 | Exceptional 98.6% |
| Croatians | 100.0 /100 | #28 | Exceptional 98.6% |
| French | 100.0 /100 | #29 | Exceptional 98.6% |
| Europeans | 100.0 /100 | #30 | Exceptional 98.6% |
| Czechs | 100.0 /100 | #31 | Exceptional 98.6% |
| French Canadians | 100.0 /100 | #32 | Exceptional 98.6% |
| Scandinavians | 100.0 /100 | #33 | Exceptional 98.6% |
| Chinese | 100.0 /100 | #34 | Exceptional 98.5% |
| Swiss | 100.0 /100 | #35 | Exceptional 98.5% |
| British | 99.9 /100 | #36 | Exceptional 98.5% |
| Italians | 99.9 /100 | #37 | Exceptional 98.5% |
| Latvians | 99.9 /100 | #38 | Exceptional 98.5% |
| Chippewa | 99.9 /100 | #39 | Exceptional 98.5% |
| Luxembourgers | 99.9 /100 | #40 | Exceptional 98.5% |