Senegalese vs Immigrants from Vietnam Single Father Poverty
COMPARE
Senegalese
Immigrants from Vietnam
Single Father Poverty
Single Father Poverty Comparison
Senegalese
Immigrants from Vietnam
16.9%
SINGLE FATHER POVERTY
3.2/ 100
METRIC RATING
233rd/ 347
METRIC RANK
14.1%
SINGLE FATHER POVERTY
100.0/ 100
METRIC RATING
14th/ 347
METRIC RANK
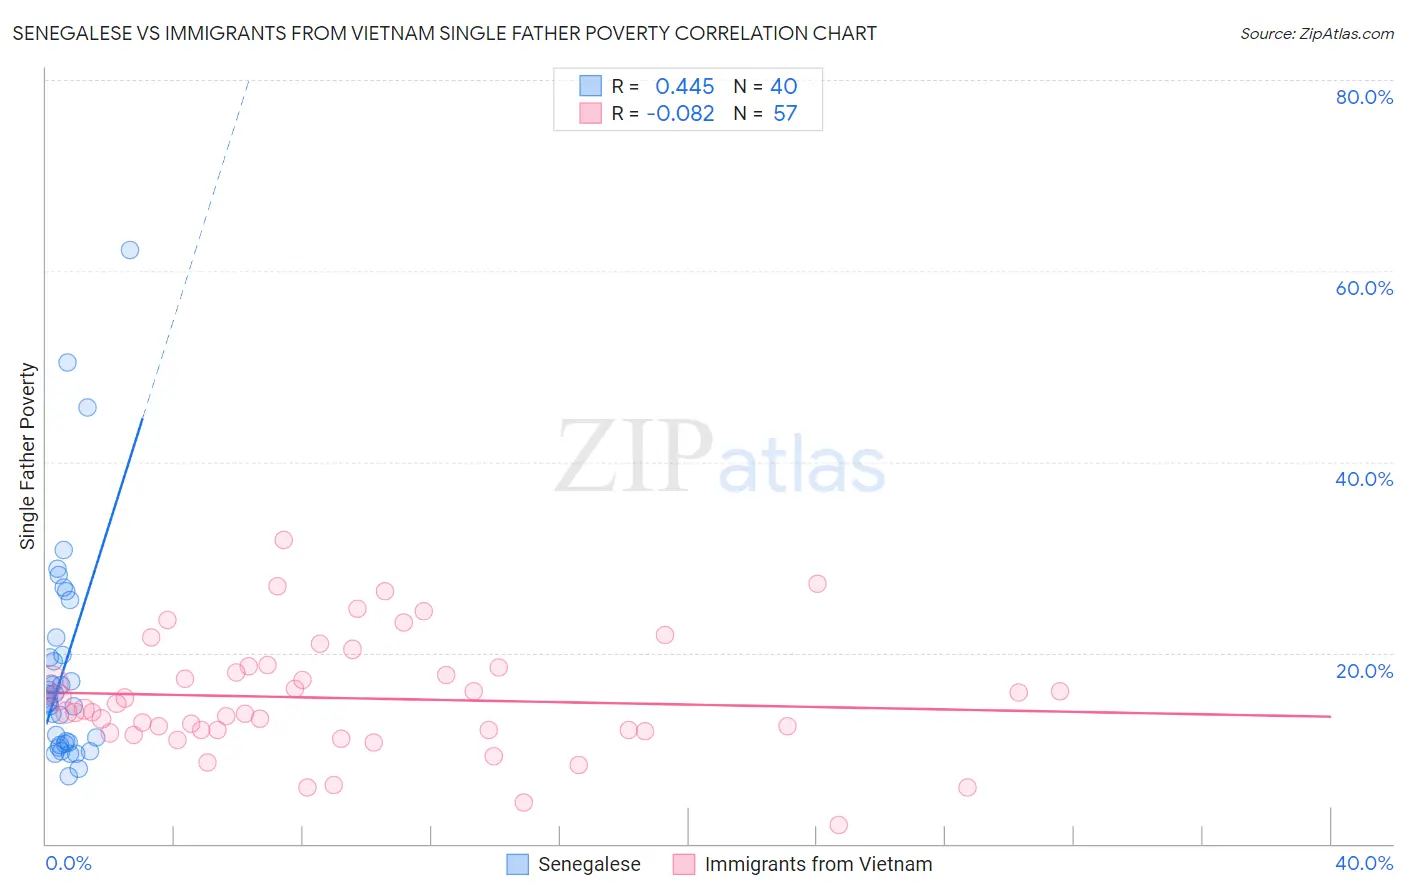
Senegalese vs Immigrants from Vietnam Single Father Poverty Correlation Chart
The statistical analysis conducted on geographies consisting of 73,350,667 people shows a moderate positive correlation between the proportion of Senegalese and poverty level among single fathers in the United States with a correlation coefficient (R) of 0.445 and weighted average of 16.9%. Similarly, the statistical analysis conducted on geographies consisting of 320,936,660 people shows a slight negative correlation between the proportion of Immigrants from Vietnam and poverty level among single fathers in the United States with a correlation coefficient (R) of -0.082 and weighted average of 14.1%, a difference of 19.5%.
Single Father Poverty Correlation Summary
| Measurement | Senegalese | Immigrants from Vietnam |
| Minimum | 7.1% | 2.0% |
| Maximum | 62.2% | 31.8% |
| Range | 55.1% | 29.8% |
| Mean | 18.6% | 15.2% |
| Median | 15.2% | 13.8% |
| Interquartile 25% (IQ1) | 10.5% | 11.8% |
| Interquartile 75% (IQ3) | 20.7% | 18.5% |
| Interquartile Range (IQR) | 10.1% | 6.7% |
| Standard Deviation (Sample) | 11.8% | 6.1% |
| Standard Deviation (Population) | 11.7% | 6.0% |
Similar Demographics by Single Father Poverty
Demographics Similar to Senegalese by Single Father Poverty
In terms of single father poverty, the demographic groups most similar to Senegalese are Marshallese (16.9%, a difference of 0.030%), Immigrants from Western Europe (16.9%, a difference of 0.12%), Immigrants from Germany (16.9%, a difference of 0.12%), Subsaharan African (16.9%, a difference of 0.13%), and Immigrants from Grenada (16.9%, a difference of 0.14%).
| Demographics | Rating | Rank | Single Father Poverty |
| Hispanics or Latinos | 6.1 /100 | #226 | Tragic 16.8% |
| British | 5.6 /100 | #227 | Tragic 16.8% |
| Belgians | 5.3 /100 | #228 | Tragic 16.8% |
| Israelis | 4.6 /100 | #229 | Tragic 16.8% |
| Immigrants | Trinidad and Tobago | 4.5 /100 | #230 | Tragic 16.8% |
| Spanish Americans | 3.7 /100 | #231 | Tragic 16.9% |
| Immigrants | Grenada | 3.7 /100 | #232 | Tragic 16.9% |
| Senegalese | 3.2 /100 | #233 | Tragic 16.9% |
| Marshallese | 3.1 /100 | #234 | Tragic 16.9% |
| Immigrants | Western Europe | 2.9 /100 | #235 | Tragic 16.9% |
| Immigrants | Germany | 2.9 /100 | #236 | Tragic 16.9% |
| Sub-Saharan Africans | 2.9 /100 | #237 | Tragic 16.9% |
| Immigrants | Saudi Arabia | 2.7 /100 | #238 | Tragic 16.9% |
| Bermudans | 2.6 /100 | #239 | Tragic 16.9% |
| Finns | 2.6 /100 | #240 | Tragic 16.9% |
Demographics Similar to Immigrants from Vietnam by Single Father Poverty
In terms of single father poverty, the demographic groups most similar to Immigrants from Vietnam are Sri Lankan (14.2%, a difference of 0.050%), Immigrants from Iran (14.2%, a difference of 0.26%), Immigrants from Philippines (14.0%, a difference of 0.70%), Immigrants from Hong Kong (14.2%, a difference of 0.71%), and Soviet Union (14.3%, a difference of 0.74%).
| Demographics | Rating | Rank | Single Father Poverty |
| Immigrants | Taiwan | 100.0 /100 | #7 | Exceptional 13.7% |
| Samoans | 100.0 /100 | #8 | Exceptional 13.8% |
| Afghans | 100.0 /100 | #9 | Exceptional 14.0% |
| Koreans | 100.0 /100 | #10 | Exceptional 14.0% |
| Filipinos | 100.0 /100 | #11 | Exceptional 14.0% |
| Immigrants | India | 100.0 /100 | #12 | Exceptional 14.0% |
| Immigrants | Philippines | 100.0 /100 | #13 | Exceptional 14.0% |
| Immigrants | Vietnam | 100.0 /100 | #14 | Exceptional 14.1% |
| Sri Lankans | 100.0 /100 | #15 | Exceptional 14.2% |
| Immigrants | Iran | 100.0 /100 | #16 | Exceptional 14.2% |
| Immigrants | Hong Kong | 100.0 /100 | #17 | Exceptional 14.2% |
| Soviet Union | 100.0 /100 | #18 | Exceptional 14.3% |
| Immigrants | Iraq | 100.0 /100 | #19 | Exceptional 14.3% |
| Immigrants | Singapore | 100.0 /100 | #20 | Exceptional 14.3% |
| Immigrants | Afghanistan | 100.0 /100 | #21 | Exceptional 14.3% |