Cherokee vs Immigrants from Oceania Single Father Poverty
COMPARE
Cherokee
Immigrants from Oceania
Single Father Poverty
Single Father Poverty Comparison
Cherokee
Immigrants from Oceania
19.6%
SINGLE FATHER POVERTY
0.0/ 100
METRIC RATING
321st/ 347
METRIC RANK
15.4%
SINGLE FATHER POVERTY
99.1/ 100
METRIC RATING
85th/ 347
METRIC RANK
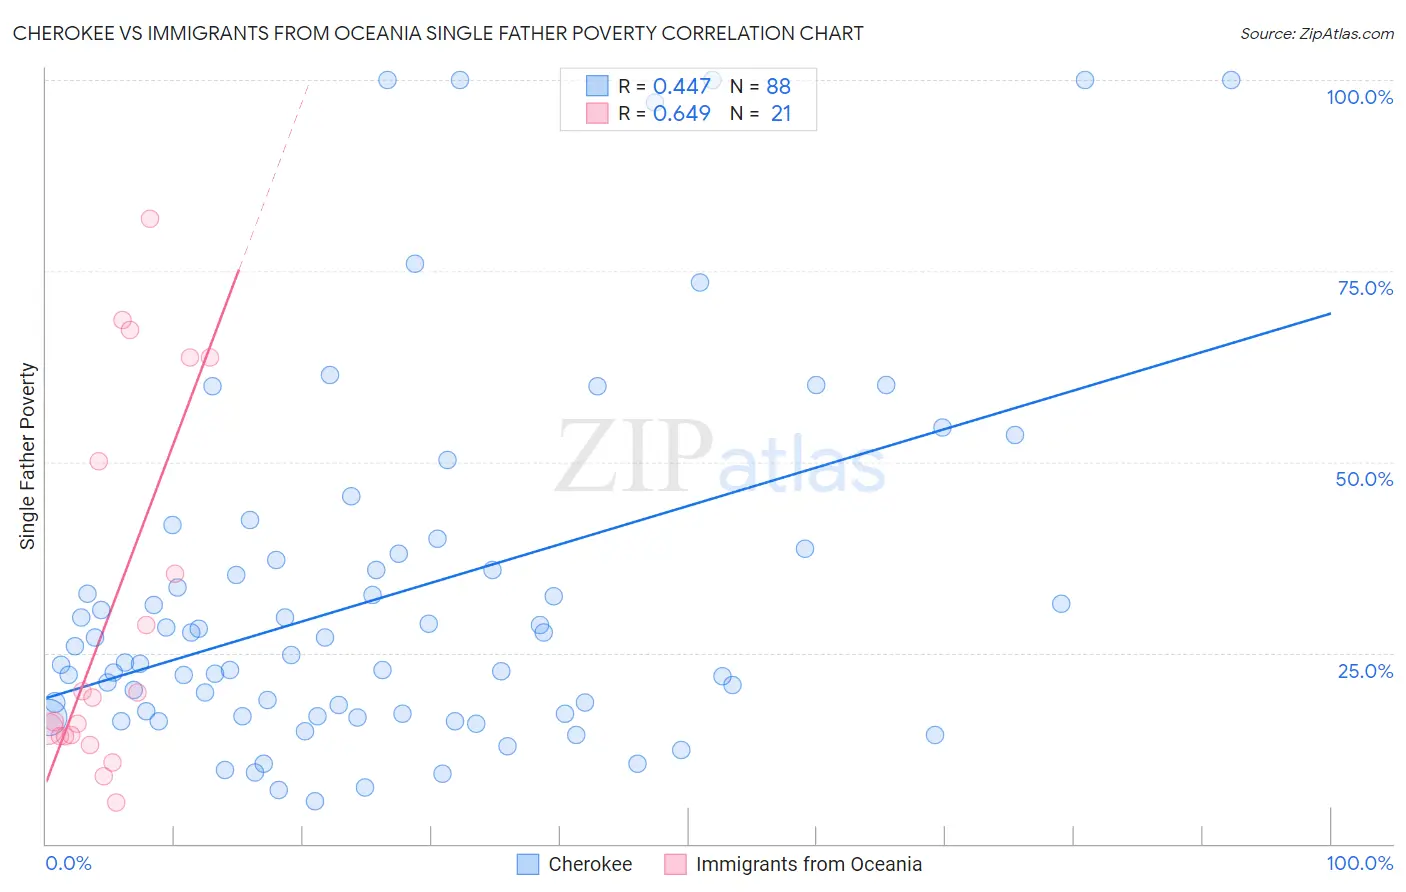
Cherokee vs Immigrants from Oceania Single Father Poverty Correlation Chart
The statistical analysis conducted on geographies consisting of 376,598,860 people shows a moderate positive correlation between the proportion of Cherokee and poverty level among single fathers in the United States with a correlation coefficient (R) of 0.447 and weighted average of 19.6%. Similarly, the statistical analysis conducted on geographies consisting of 248,038,914 people shows a significant positive correlation between the proportion of Immigrants from Oceania and poverty level among single fathers in the United States with a correlation coefficient (R) of 0.649 and weighted average of 15.4%, a difference of 27.2%.
Single Father Poverty Correlation Summary
| Measurement | Cherokee | Immigrants from Oceania |
| Minimum | 5.6% | 5.4% |
| Maximum | 100.0% | 81.8% |
| Range | 94.4% | 76.5% |
| Mean | 32.7% | 30.7% |
| Median | 25.3% | 19.1% |
| Interquartile 25% (IQ1) | 17.1% | 14.1% |
| Interquartile 75% (IQ3) | 37.5% | 56.9% |
| Interquartile Range (IQR) | 20.4% | 42.8% |
| Standard Deviation (Sample) | 23.5% | 24.2% |
| Standard Deviation (Population) | 23.4% | 23.6% |
Similar Demographics by Single Father Poverty
Demographics Similar to Cherokee by Single Father Poverty
In terms of single father poverty, the demographic groups most similar to Cherokee are Inupiat (19.5%, a difference of 0.85%), Creek (19.8%, a difference of 1.0%), Slovak (19.3%, a difference of 1.8%), Pennsylvania German (20.0%, a difference of 1.9%), and American (20.1%, a difference of 2.1%).
| Demographics | Rating | Rank | Single Father Poverty |
| Delaware | 0.0 /100 | #314 | Tragic 18.9% |
| Chickasaw | 0.0 /100 | #315 | Tragic 19.0% |
| Osage | 0.0 /100 | #316 | Tragic 19.0% |
| Dominicans | 0.0 /100 | #317 | Tragic 19.1% |
| Dutch West Indians | 0.0 /100 | #318 | Tragic 19.2% |
| Slovaks | 0.0 /100 | #319 | Tragic 19.3% |
| Inupiat | 0.0 /100 | #320 | Tragic 19.5% |
| Cherokee | 0.0 /100 | #321 | Tragic 19.6% |
| Creek | 0.0 /100 | #322 | Tragic 19.8% |
| Pennsylvania Germans | 0.0 /100 | #323 | Tragic 20.0% |
| Americans | 0.0 /100 | #324 | Tragic 20.1% |
| Blacks/African Americans | 0.0 /100 | #325 | Tragic 20.4% |
| Immigrants | Yemen | 0.0 /100 | #326 | Tragic 20.6% |
| Choctaw | 0.0 /100 | #327 | Tragic 20.7% |
| Pueblo | 0.0 /100 | #328 | Tragic 21.1% |
Demographics Similar to Immigrants from Oceania by Single Father Poverty
In terms of single father poverty, the demographic groups most similar to Immigrants from Oceania are Peruvian (15.4%, a difference of 0.12%), Immigrants from Russia (15.5%, a difference of 0.12%), Brazilian (15.5%, a difference of 0.13%), Burmese (15.5%, a difference of 0.16%), and Immigrants from Korea (15.5%, a difference of 0.22%).
| Demographics | Rating | Rank | Single Father Poverty |
| Tlingit-Haida | 99.5 /100 | #78 | Exceptional 15.3% |
| Immigrants | Northern Africa | 99.5 /100 | #79 | Exceptional 15.3% |
| Armenians | 99.4 /100 | #80 | Exceptional 15.4% |
| Immigrants | Congo | 99.4 /100 | #81 | Exceptional 15.4% |
| Immigrants | Ukraine | 99.4 /100 | #82 | Exceptional 15.4% |
| Chinese | 99.3 /100 | #83 | Exceptional 15.4% |
| Peruvians | 99.2 /100 | #84 | Exceptional 15.4% |
| Immigrants | Oceania | 99.1 /100 | #85 | Exceptional 15.4% |
| Immigrants | Russia | 99.0 /100 | #86 | Exceptional 15.5% |
| Brazilians | 99.0 /100 | #87 | Exceptional 15.5% |
| Burmese | 99.0 /100 | #88 | Exceptional 15.5% |
| Immigrants | Korea | 99.0 /100 | #89 | Exceptional 15.5% |
| Mexican American Indians | 98.7 /100 | #90 | Exceptional 15.5% |
| Immigrants | Romania | 98.6 /100 | #91 | Exceptional 15.5% |
| Immigrants | Serbia | 98.5 /100 | #92 | Exceptional 15.5% |