Colombian vs Immigrants from Oceania Single Father Poverty
COMPARE
Colombian
Immigrants from Oceania
Single Father Poverty
Single Father Poverty Comparison
Colombians
Immigrants from Oceania
16.1%
SINGLE FATHER POVERTY
77.1/ 100
METRIC RATING
147th/ 347
METRIC RANK
15.4%
SINGLE FATHER POVERTY
99.1/ 100
METRIC RATING
85th/ 347
METRIC RANK
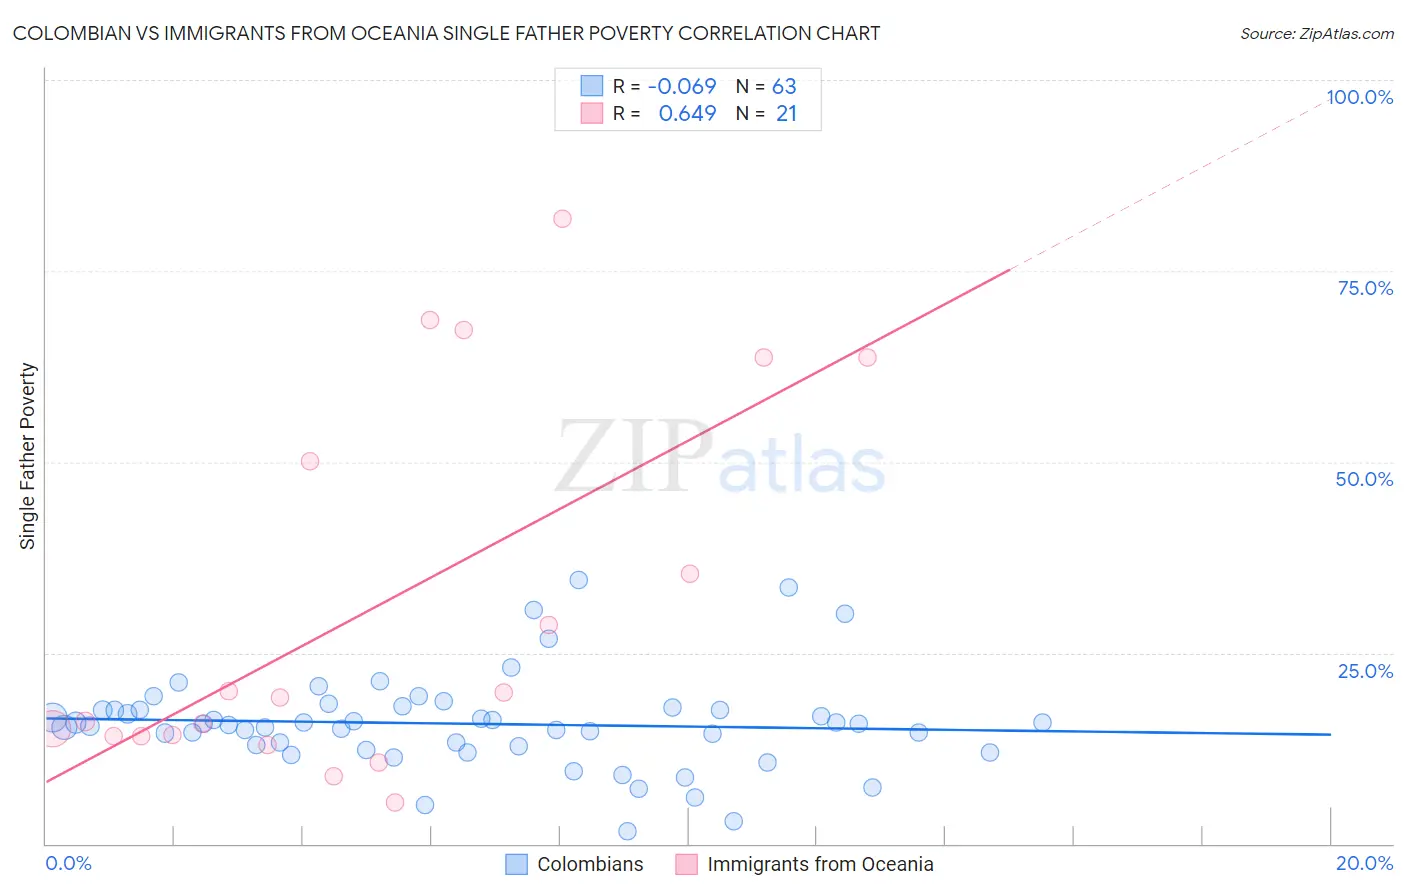
Colombian vs Immigrants from Oceania Single Father Poverty Correlation Chart
The statistical analysis conducted on geographies consisting of 329,050,963 people shows a slight negative correlation between the proportion of Colombians and poverty level among single fathers in the United States with a correlation coefficient (R) of -0.069 and weighted average of 16.1%. Similarly, the statistical analysis conducted on geographies consisting of 248,038,914 people shows a significant positive correlation between the proportion of Immigrants from Oceania and poverty level among single fathers in the United States with a correlation coefficient (R) of 0.649 and weighted average of 15.4%, a difference of 4.1%.
Single Father Poverty Correlation Summary
| Measurement | Colombian | Immigrants from Oceania |
| Minimum | 1.6% | 5.4% |
| Maximum | 34.5% | 81.8% |
| Range | 32.9% | 76.5% |
| Mean | 15.7% | 30.7% |
| Median | 15.6% | 19.1% |
| Interquartile 25% (IQ1) | 12.8% | 14.1% |
| Interquartile 75% (IQ3) | 17.5% | 56.9% |
| Interquartile Range (IQR) | 4.7% | 42.8% |
| Standard Deviation (Sample) | 6.2% | 24.2% |
| Standard Deviation (Population) | 6.2% | 23.6% |
Similar Demographics by Single Father Poverty
Demographics Similar to Colombians by Single Father Poverty
In terms of single father poverty, the demographic groups most similar to Colombians are Nigerian (16.1%, a difference of 0.020%), Immigrants from Hungary (16.1%, a difference of 0.080%), South African (16.1%, a difference of 0.12%), Jordanian (16.1%, a difference of 0.18%), and Immigrants from Western Asia (16.0%, a difference of 0.24%).
| Demographics | Rating | Rank | Single Father Poverty |
| Immigrants | Netherlands | 85.3 /100 | #140 | Excellent 16.0% |
| Liberians | 83.3 /100 | #141 | Excellent 16.0% |
| Immigrants | Mexico | 83.3 /100 | #142 | Excellent 16.0% |
| Immigrants | Central America | 83.1 /100 | #143 | Excellent 16.0% |
| Immigrants | Kuwait | 81.4 /100 | #144 | Excellent 16.0% |
| Immigrants | Western Asia | 80.7 /100 | #145 | Excellent 16.0% |
| Immigrants | Hungary | 78.3 /100 | #146 | Good 16.1% |
| Colombians | 77.1 /100 | #147 | Good 16.1% |
| Nigerians | 76.8 /100 | #148 | Good 16.1% |
| South Africans | 75.1 /100 | #149 | Good 16.1% |
| Jordanians | 74.2 /100 | #150 | Good 16.1% |
| Immigrants | France | 73.1 /100 | #151 | Good 16.1% |
| Immigrants | Zimbabwe | 72.1 /100 | #152 | Good 16.1% |
| Immigrants | Israel | 72.0 /100 | #153 | Good 16.1% |
| Mexicans | 70.1 /100 | #154 | Good 16.1% |
Demographics Similar to Immigrants from Oceania by Single Father Poverty
In terms of single father poverty, the demographic groups most similar to Immigrants from Oceania are Peruvian (15.4%, a difference of 0.12%), Immigrants from Russia (15.5%, a difference of 0.12%), Brazilian (15.5%, a difference of 0.13%), Burmese (15.5%, a difference of 0.16%), and Immigrants from Korea (15.5%, a difference of 0.22%).
| Demographics | Rating | Rank | Single Father Poverty |
| Tlingit-Haida | 99.5 /100 | #78 | Exceptional 15.3% |
| Immigrants | Northern Africa | 99.5 /100 | #79 | Exceptional 15.3% |
| Armenians | 99.4 /100 | #80 | Exceptional 15.4% |
| Immigrants | Congo | 99.4 /100 | #81 | Exceptional 15.4% |
| Immigrants | Ukraine | 99.4 /100 | #82 | Exceptional 15.4% |
| Chinese | 99.3 /100 | #83 | Exceptional 15.4% |
| Peruvians | 99.2 /100 | #84 | Exceptional 15.4% |
| Immigrants | Oceania | 99.1 /100 | #85 | Exceptional 15.4% |
| Immigrants | Russia | 99.0 /100 | #86 | Exceptional 15.5% |
| Brazilians | 99.0 /100 | #87 | Exceptional 15.5% |
| Burmese | 99.0 /100 | #88 | Exceptional 15.5% |
| Immigrants | Korea | 99.0 /100 | #89 | Exceptional 15.5% |
| Mexican American Indians | 98.7 /100 | #90 | Exceptional 15.5% |
| Immigrants | Romania | 98.6 /100 | #91 | Exceptional 15.5% |
| Immigrants | Serbia | 98.5 /100 | #92 | Exceptional 15.5% |