Subsaharan African vs Immigrants from Oceania Single Father Poverty
COMPARE
Subsaharan African
Immigrants from Oceania
Single Father Poverty
Single Father Poverty Comparison
Sub-Saharan Africans
Immigrants from Oceania
16.9%
SINGLE FATHER POVERTY
2.9/ 100
METRIC RATING
237th/ 347
METRIC RANK
15.4%
SINGLE FATHER POVERTY
99.1/ 100
METRIC RATING
85th/ 347
METRIC RANK
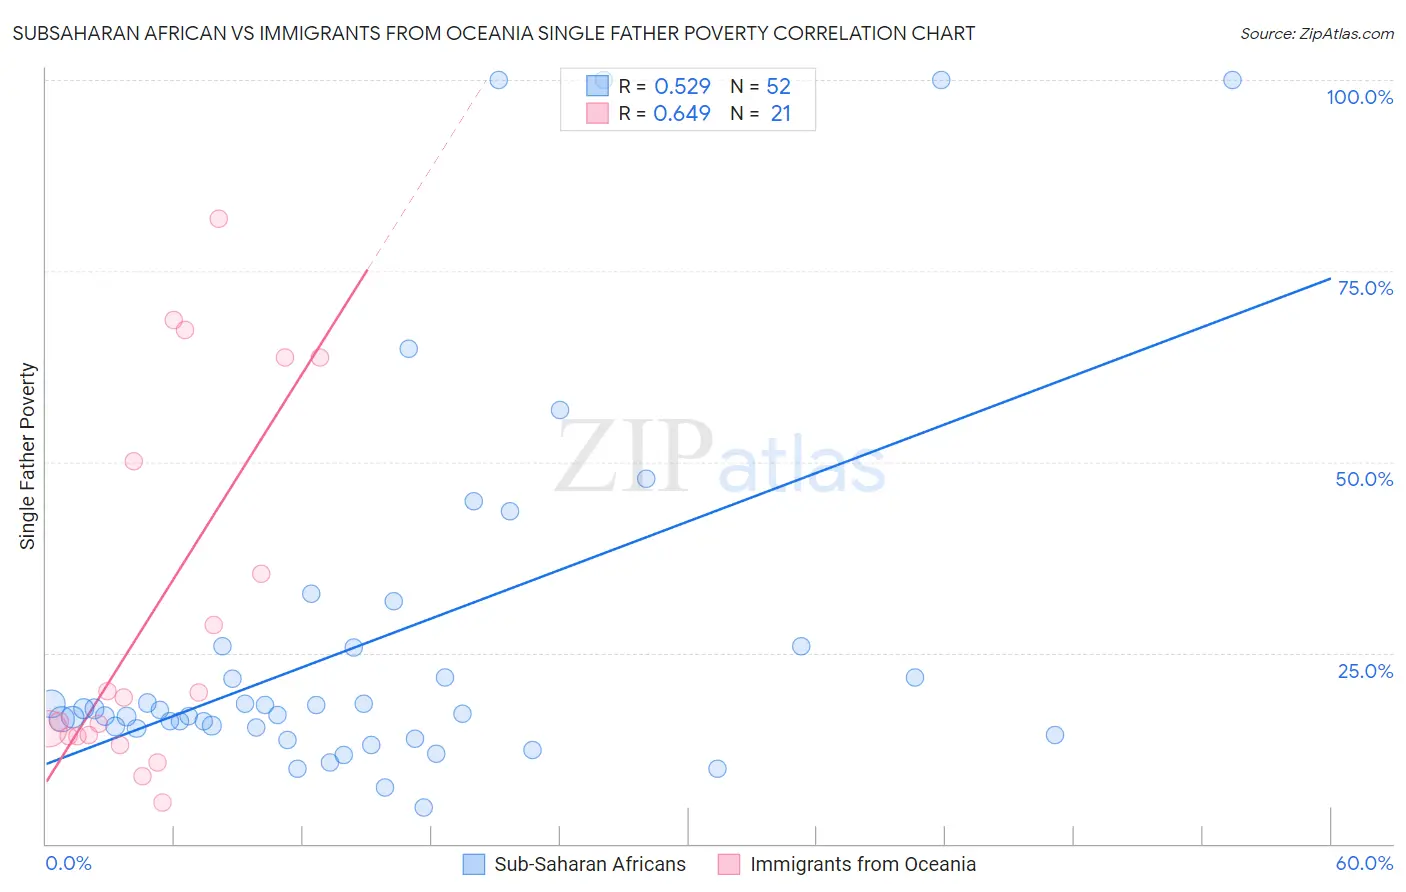
Subsaharan African vs Immigrants from Oceania Single Father Poverty Correlation Chart
The statistical analysis conducted on geographies consisting of 386,638,837 people shows a substantial positive correlation between the proportion of Sub-Saharan Africans and poverty level among single fathers in the United States with a correlation coefficient (R) of 0.529 and weighted average of 16.9%. Similarly, the statistical analysis conducted on geographies consisting of 248,038,914 people shows a significant positive correlation between the proportion of Immigrants from Oceania and poverty level among single fathers in the United States with a correlation coefficient (R) of 0.649 and weighted average of 15.4%, a difference of 9.6%.
Single Father Poverty Correlation Summary
| Measurement | Subsaharan African | Immigrants from Oceania |
| Minimum | 4.8% | 5.4% |
| Maximum | 100.0% | 81.8% |
| Range | 95.2% | 76.5% |
| Mean | 26.7% | 30.7% |
| Median | 17.3% | 19.1% |
| Interquartile 25% (IQ1) | 15.1% | 14.1% |
| Interquartile 75% (IQ3) | 25.8% | 56.9% |
| Interquartile Range (IQR) | 10.6% | 42.8% |
| Standard Deviation (Sample) | 24.4% | 24.2% |
| Standard Deviation (Population) | 24.1% | 23.6% |
Similar Demographics by Single Father Poverty
Demographics Similar to Sub-Saharan Africans by Single Father Poverty
In terms of single father poverty, the demographic groups most similar to Sub-Saharan Africans are Immigrants from Western Europe (16.9%, a difference of 0.0%), Immigrants from Germany (16.9%, a difference of 0.0%), Immigrants from Saudi Arabia (16.9%, a difference of 0.070%), Bermudan (16.9%, a difference of 0.090%), and Marshallese (16.9%, a difference of 0.10%).
| Demographics | Rating | Rank | Single Father Poverty |
| Immigrants | Trinidad and Tobago | 4.5 /100 | #230 | Tragic 16.8% |
| Spanish Americans | 3.7 /100 | #231 | Tragic 16.9% |
| Immigrants | Grenada | 3.7 /100 | #232 | Tragic 16.9% |
| Senegalese | 3.2 /100 | #233 | Tragic 16.9% |
| Marshallese | 3.1 /100 | #234 | Tragic 16.9% |
| Immigrants | Western Europe | 2.9 /100 | #235 | Tragic 16.9% |
| Immigrants | Germany | 2.9 /100 | #236 | Tragic 16.9% |
| Sub-Saharan Africans | 2.9 /100 | #237 | Tragic 16.9% |
| Immigrants | Saudi Arabia | 2.7 /100 | #238 | Tragic 16.9% |
| Bermudans | 2.6 /100 | #239 | Tragic 16.9% |
| Finns | 2.6 /100 | #240 | Tragic 16.9% |
| Czechs | 2.3 /100 | #241 | Tragic 17.0% |
| Moroccans | 2.1 /100 | #242 | Tragic 17.0% |
| Immigrants | Cabo Verde | 1.6 /100 | #243 | Tragic 17.0% |
| Hondurans | 1.6 /100 | #244 | Tragic 17.0% |
Demographics Similar to Immigrants from Oceania by Single Father Poverty
In terms of single father poverty, the demographic groups most similar to Immigrants from Oceania are Peruvian (15.4%, a difference of 0.12%), Immigrants from Russia (15.5%, a difference of 0.12%), Brazilian (15.5%, a difference of 0.13%), Burmese (15.5%, a difference of 0.16%), and Immigrants from Korea (15.5%, a difference of 0.22%).
| Demographics | Rating | Rank | Single Father Poverty |
| Tlingit-Haida | 99.5 /100 | #78 | Exceptional 15.3% |
| Immigrants | Northern Africa | 99.5 /100 | #79 | Exceptional 15.3% |
| Armenians | 99.4 /100 | #80 | Exceptional 15.4% |
| Immigrants | Congo | 99.4 /100 | #81 | Exceptional 15.4% |
| Immigrants | Ukraine | 99.4 /100 | #82 | Exceptional 15.4% |
| Chinese | 99.3 /100 | #83 | Exceptional 15.4% |
| Peruvians | 99.2 /100 | #84 | Exceptional 15.4% |
| Immigrants | Oceania | 99.1 /100 | #85 | Exceptional 15.4% |
| Immigrants | Russia | 99.0 /100 | #86 | Exceptional 15.5% |
| Brazilians | 99.0 /100 | #87 | Exceptional 15.5% |
| Burmese | 99.0 /100 | #88 | Exceptional 15.5% |
| Immigrants | Korea | 99.0 /100 | #89 | Exceptional 15.5% |
| Mexican American Indians | 98.7 /100 | #90 | Exceptional 15.5% |
| Immigrants | Romania | 98.6 /100 | #91 | Exceptional 15.5% |
| Immigrants | Serbia | 98.5 /100 | #92 | Exceptional 15.5% |