Immigrants from Moldova vs Immigrants from Oceania Single Father Poverty
COMPARE
Immigrants from Moldova
Immigrants from Oceania
Single Father Poverty
Single Father Poverty Comparison
Immigrants from Moldova
Immigrants from Oceania
15.2%
SINGLE FATHER POVERTY
99.8/ 100
METRIC RATING
66th/ 347
METRIC RANK
15.4%
SINGLE FATHER POVERTY
99.1/ 100
METRIC RATING
85th/ 347
METRIC RANK
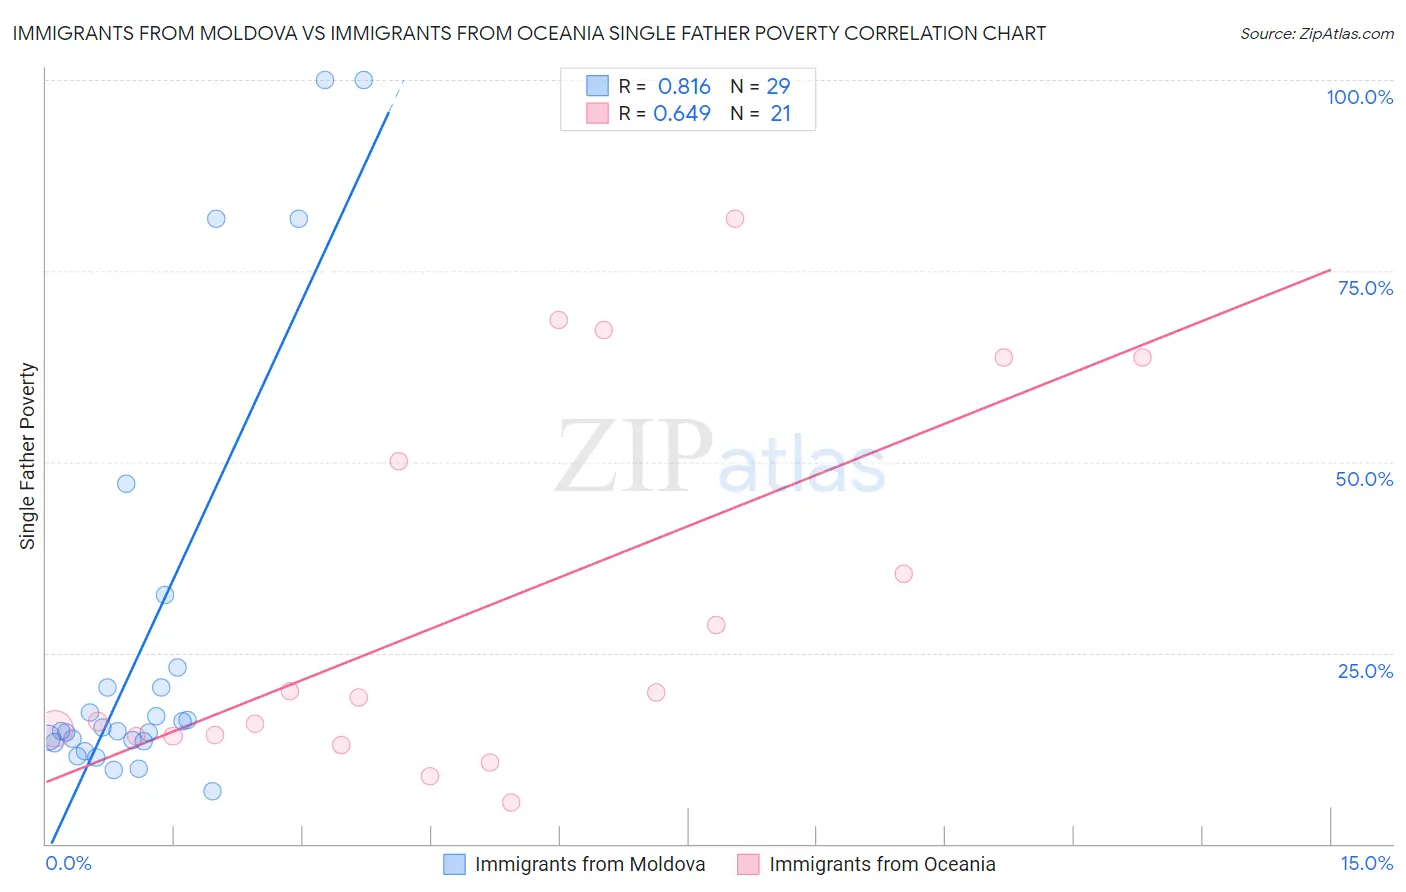
Immigrants from Moldova vs Immigrants from Oceania Single Father Poverty Correlation Chart
The statistical analysis conducted on geographies consisting of 107,585,694 people shows a very strong positive correlation between the proportion of Immigrants from Moldova and poverty level among single fathers in the United States with a correlation coefficient (R) of 0.816 and weighted average of 15.2%. Similarly, the statistical analysis conducted on geographies consisting of 248,038,914 people shows a significant positive correlation between the proportion of Immigrants from Oceania and poverty level among single fathers in the United States with a correlation coefficient (R) of 0.649 and weighted average of 15.4%, a difference of 1.5%.
Single Father Poverty Correlation Summary
| Measurement | Immigrants from Moldova | Immigrants from Oceania |
| Minimum | 6.9% | 5.4% |
| Maximum | 100.0% | 81.8% |
| Range | 93.1% | 76.5% |
| Mean | 26.8% | 30.7% |
| Median | 14.7% | 19.1% |
| Interquartile 25% (IQ1) | 13.3% | 14.1% |
| Interquartile 75% (IQ3) | 21.8% | 56.9% |
| Interquartile Range (IQR) | 8.4% | 42.8% |
| Standard Deviation (Sample) | 27.4% | 24.2% |
| Standard Deviation (Population) | 26.9% | 23.6% |
Demographics Similar to Immigrants from Moldova and Immigrants from Oceania by Single Father Poverty
In terms of single father poverty, the demographic groups most similar to Immigrants from Moldova are Immigrants from Malaysia (15.2%, a difference of 0.020%), Paraguayan (15.2%, a difference of 0.090%), Immigrants from Cameroon (15.2%, a difference of 0.18%), Japanese (15.2%, a difference of 0.20%), and Mongolian (15.3%, a difference of 0.30%). Similarly, the demographic groups most similar to Immigrants from Oceania are Peruvian (15.4%, a difference of 0.12%), Chinese (15.4%, a difference of 0.25%), Immigrants from Ukraine (15.4%, a difference of 0.34%), Immigrants from Congo (15.4%, a difference of 0.35%), and Armenian (15.4%, a difference of 0.37%).
| Demographics | Rating | Rank | Single Father Poverty |
| Immigrants | Malaysia | 99.8 /100 | #65 | Exceptional 15.2% |
| Immigrants | Moldova | 99.8 /100 | #66 | Exceptional 15.2% |
| Paraguayans | 99.7 /100 | #67 | Exceptional 15.2% |
| Immigrants | Cameroon | 99.7 /100 | #68 | Exceptional 15.2% |
| Japanese | 99.7 /100 | #69 | Exceptional 15.2% |
| Mongolians | 99.7 /100 | #70 | Exceptional 15.3% |
| Immigrants | Brazil | 99.6 /100 | #71 | Exceptional 15.3% |
| Immigrants | Lithuania | 99.6 /100 | #72 | Exceptional 15.3% |
| Kenyans | 99.6 /100 | #73 | Exceptional 15.3% |
| Maltese | 99.6 /100 | #74 | Exceptional 15.3% |
| Immigrants | Turkey | 99.5 /100 | #75 | Exceptional 15.3% |
| Immigrants | Japan | 99.5 /100 | #76 | Exceptional 15.3% |
| Immigrants | Peru | 99.5 /100 | #77 | Exceptional 15.3% |
| Tlingit-Haida | 99.5 /100 | #78 | Exceptional 15.3% |
| Immigrants | Northern Africa | 99.5 /100 | #79 | Exceptional 15.3% |
| Armenians | 99.4 /100 | #80 | Exceptional 15.4% |
| Immigrants | Congo | 99.4 /100 | #81 | Exceptional 15.4% |
| Immigrants | Ukraine | 99.4 /100 | #82 | Exceptional 15.4% |
| Chinese | 99.3 /100 | #83 | Exceptional 15.4% |
| Peruvians | 99.2 /100 | #84 | Exceptional 15.4% |
| Immigrants | Oceania | 99.1 /100 | #85 | Exceptional 15.4% |