Cherokee vs Immigrants from Eritrea Single Father Poverty
COMPARE
Cherokee
Immigrants from Eritrea
Single Father Poverty
Single Father Poverty Comparison
Cherokee
Immigrants from Eritrea
19.6%
SINGLE FATHER POVERTY
0.0/ 100
METRIC RATING
321st/ 347
METRIC RANK
14.8%
SINGLE FATHER POVERTY
100.0/ 100
METRIC RATING
43rd/ 347
METRIC RANK
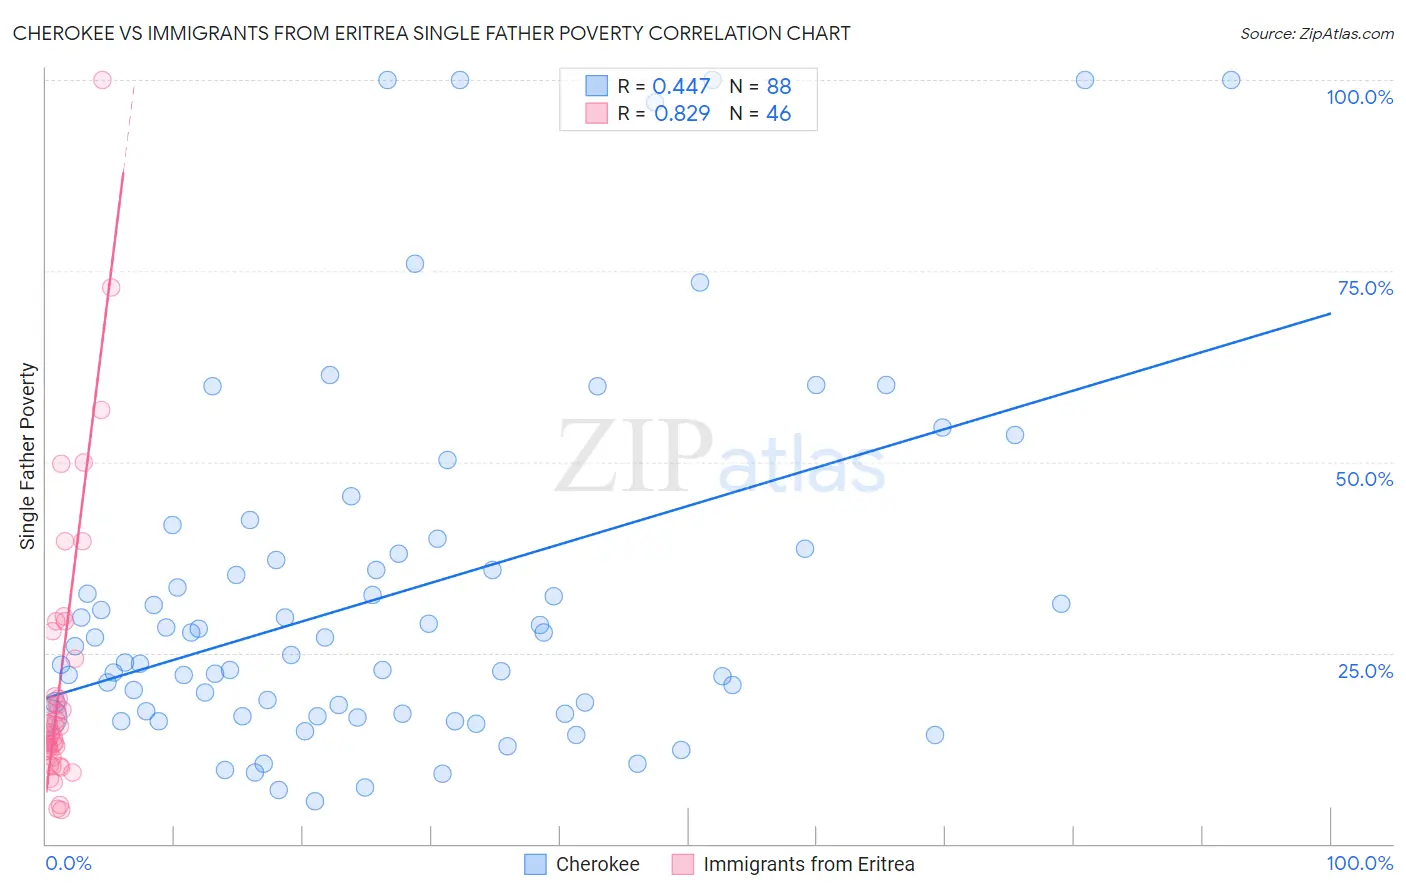
Cherokee vs Immigrants from Eritrea Single Father Poverty Correlation Chart
The statistical analysis conducted on geographies consisting of 376,598,860 people shows a moderate positive correlation between the proportion of Cherokee and poverty level among single fathers in the United States with a correlation coefficient (R) of 0.447 and weighted average of 19.6%. Similarly, the statistical analysis conducted on geographies consisting of 96,659,601 people shows a very strong positive correlation between the proportion of Immigrants from Eritrea and poverty level among single fathers in the United States with a correlation coefficient (R) of 0.829 and weighted average of 14.8%, a difference of 32.7%.
Single Father Poverty Correlation Summary
| Measurement | Cherokee | Immigrants from Eritrea |
| Minimum | 5.6% | 4.5% |
| Maximum | 100.0% | 100.0% |
| Range | 94.4% | 95.5% |
| Mean | 32.7% | 21.5% |
| Median | 25.3% | 15.0% |
| Interquartile 25% (IQ1) | 17.1% | 12.2% |
| Interquartile 75% (IQ3) | 37.5% | 24.2% |
| Interquartile Range (IQR) | 20.4% | 12.0% |
| Standard Deviation (Sample) | 23.5% | 18.6% |
| Standard Deviation (Population) | 23.4% | 18.4% |
Similar Demographics by Single Father Poverty
Demographics Similar to Cherokee by Single Father Poverty
In terms of single father poverty, the demographic groups most similar to Cherokee are Inupiat (19.5%, a difference of 0.85%), Creek (19.8%, a difference of 1.0%), Slovak (19.3%, a difference of 1.8%), Pennsylvania German (20.0%, a difference of 1.9%), and American (20.1%, a difference of 2.1%).
| Demographics | Rating | Rank | Single Father Poverty |
| Delaware | 0.0 /100 | #314 | Tragic 18.9% |
| Chickasaw | 0.0 /100 | #315 | Tragic 19.0% |
| Osage | 0.0 /100 | #316 | Tragic 19.0% |
| Dominicans | 0.0 /100 | #317 | Tragic 19.1% |
| Dutch West Indians | 0.0 /100 | #318 | Tragic 19.2% |
| Slovaks | 0.0 /100 | #319 | Tragic 19.3% |
| Inupiat | 0.0 /100 | #320 | Tragic 19.5% |
| Cherokee | 0.0 /100 | #321 | Tragic 19.6% |
| Creek | 0.0 /100 | #322 | Tragic 19.8% |
| Pennsylvania Germans | 0.0 /100 | #323 | Tragic 20.0% |
| Americans | 0.0 /100 | #324 | Tragic 20.1% |
| Blacks/African Americans | 0.0 /100 | #325 | Tragic 20.4% |
| Immigrants | Yemen | 0.0 /100 | #326 | Tragic 20.6% |
| Choctaw | 0.0 /100 | #327 | Tragic 20.7% |
| Pueblo | 0.0 /100 | #328 | Tragic 21.1% |
Demographics Similar to Immigrants from Eritrea by Single Father Poverty
In terms of single father poverty, the demographic groups most similar to Immigrants from Eritrea are Indian (Asian) (14.8%, a difference of 0.040%), Immigrants from Nepal (14.8%, a difference of 0.040%), Pima (14.8%, a difference of 0.21%), Immigrants from Asia (14.7%, a difference of 0.41%), and Bolivian (14.7%, a difference of 0.59%).
| Demographics | Rating | Rank | Single Father Poverty |
| Immigrants | Indonesia | 100.0 /100 | #36 | Exceptional 14.7% |
| Immigrants | Eastern Africa | 100.0 /100 | #37 | Exceptional 14.7% |
| Bolivians | 100.0 /100 | #38 | Exceptional 14.7% |
| Immigrants | Asia | 100.0 /100 | #39 | Exceptional 14.7% |
| Pima | 100.0 /100 | #40 | Exceptional 14.8% |
| Indians (Asian) | 100.0 /100 | #41 | Exceptional 14.8% |
| Immigrants | Nepal | 100.0 /100 | #42 | Exceptional 14.8% |
| Immigrants | Eritrea | 100.0 /100 | #43 | Exceptional 14.8% |
| Salvadorans | 100.0 /100 | #44 | Exceptional 14.9% |
| Immigrants | Somalia | 100.0 /100 | #45 | Exceptional 14.9% |
| Immigrants | Cambodia | 99.9 /100 | #46 | Exceptional 14.9% |
| Immigrants | China | 99.9 /100 | #47 | Exceptional 14.9% |
| Malaysians | 99.9 /100 | #48 | Exceptional 14.9% |
| Immigrants | Eastern Asia | 99.9 /100 | #49 | Exceptional 15.0% |
| Bhutanese | 99.9 /100 | #50 | Exceptional 15.0% |