Kenyan vs Immigrants from Uruguay Single Father Poverty
COMPARE
Kenyan
Immigrants from Uruguay
Single Father Poverty
Single Father Poverty Comparison
Kenyans
Immigrants from Uruguay
15.3%
SINGLE FATHER POVERTY
99.6/ 100
METRIC RATING
73rd/ 347
METRIC RANK
15.6%
SINGLE FATHER POVERTY
98.2/ 100
METRIC RATING
94th/ 347
METRIC RANK
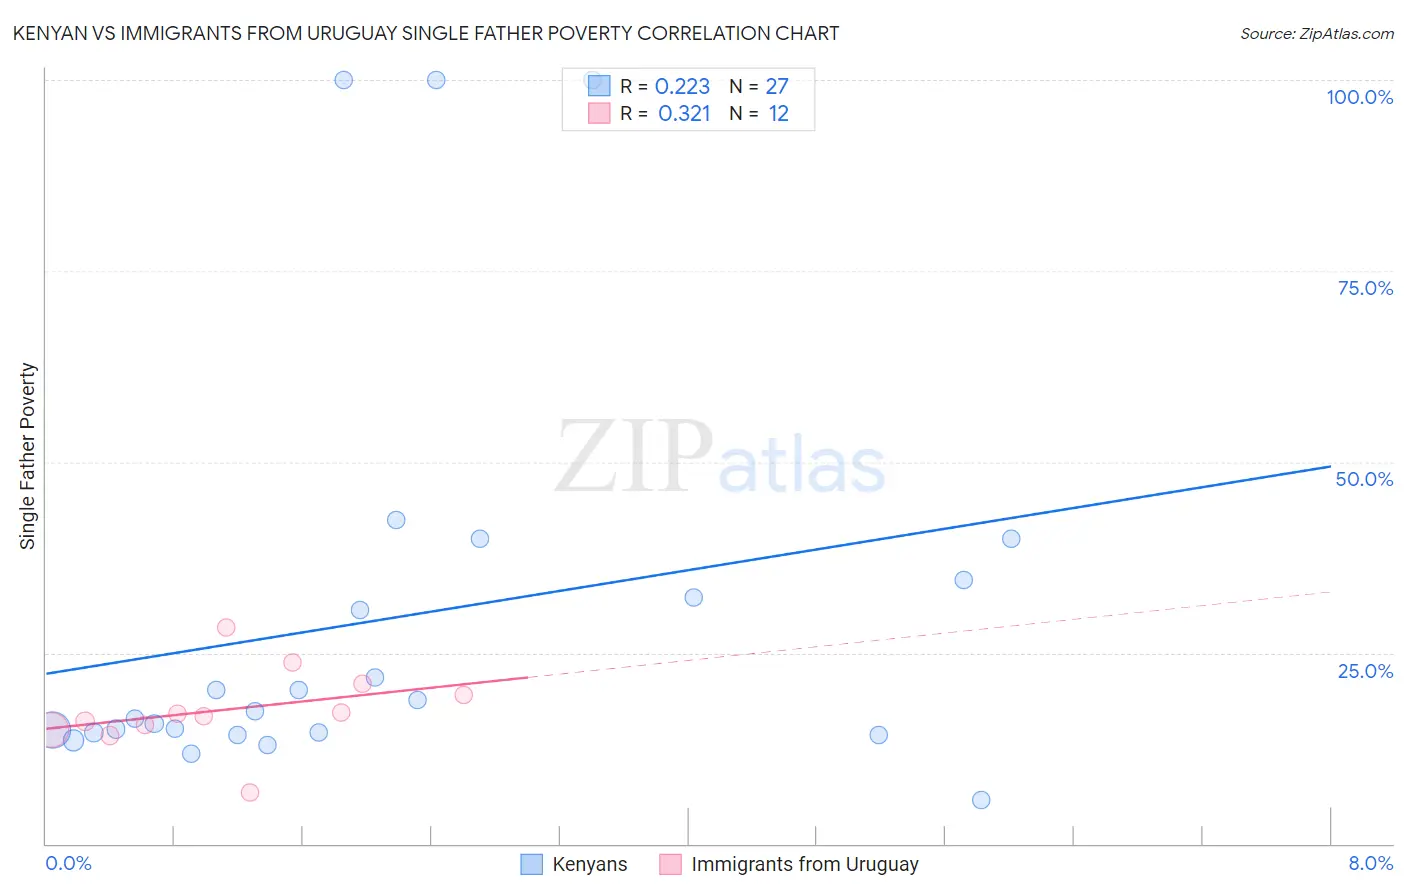
Kenyan vs Immigrants from Uruguay Single Father Poverty Correlation Chart
The statistical analysis conducted on geographies consisting of 147,839,292 people shows a weak positive correlation between the proportion of Kenyans and poverty level among single fathers in the United States with a correlation coefficient (R) of 0.223 and weighted average of 15.3%. Similarly, the statistical analysis conducted on geographies consisting of 118,124,397 people shows a mild positive correlation between the proportion of Immigrants from Uruguay and poverty level among single fathers in the United States with a correlation coefficient (R) of 0.321 and weighted average of 15.6%, a difference of 1.7%.
Single Father Poverty Correlation Summary
| Measurement | Kenyan | Immigrants from Uruguay |
| Minimum | 5.7% | 6.7% |
| Maximum | 100.0% | 28.4% |
| Range | 94.3% | 21.7% |
| Mean | 29.5% | 17.6% |
| Median | 17.3% | 16.9% |
| Interquartile 25% (IQ1) | 14.6% | 15.2% |
| Interquartile 75% (IQ3) | 34.6% | 20.2% |
| Interquartile Range (IQR) | 20.0% | 5.0% |
| Standard Deviation (Sample) | 27.1% | 5.3% |
| Standard Deviation (Population) | 26.6% | 5.1% |
Similar Demographics by Single Father Poverty
Demographics Similar to Kenyans by Single Father Poverty
In terms of single father poverty, the demographic groups most similar to Kenyans are Maltese (15.3%, a difference of 0.040%), Immigrants from Turkey (15.3%, a difference of 0.060%), Immigrants from Lithuania (15.3%, a difference of 0.090%), Immigrants from Japan (15.3%, a difference of 0.14%), and Immigrants from Peru (15.3%, a difference of 0.15%).
| Demographics | Rating | Rank | Single Father Poverty |
| Immigrants | Moldova | 99.8 /100 | #66 | Exceptional 15.2% |
| Paraguayans | 99.7 /100 | #67 | Exceptional 15.2% |
| Immigrants | Cameroon | 99.7 /100 | #68 | Exceptional 15.2% |
| Japanese | 99.7 /100 | #69 | Exceptional 15.2% |
| Mongolians | 99.7 /100 | #70 | Exceptional 15.3% |
| Immigrants | Brazil | 99.6 /100 | #71 | Exceptional 15.3% |
| Immigrants | Lithuania | 99.6 /100 | #72 | Exceptional 15.3% |
| Kenyans | 99.6 /100 | #73 | Exceptional 15.3% |
| Maltese | 99.6 /100 | #74 | Exceptional 15.3% |
| Immigrants | Turkey | 99.5 /100 | #75 | Exceptional 15.3% |
| Immigrants | Japan | 99.5 /100 | #76 | Exceptional 15.3% |
| Immigrants | Peru | 99.5 /100 | #77 | Exceptional 15.3% |
| Tlingit-Haida | 99.5 /100 | #78 | Exceptional 15.3% |
| Immigrants | Northern Africa | 99.5 /100 | #79 | Exceptional 15.3% |
| Armenians | 99.4 /100 | #80 | Exceptional 15.4% |
Demographics Similar to Immigrants from Uruguay by Single Father Poverty
In terms of single father poverty, the demographic groups most similar to Immigrants from Uruguay are Immigrants from Kazakhstan (15.6%, a difference of 0.050%), Immigrants from Belgium (15.6%, a difference of 0.060%), Yaqui (15.6%, a difference of 0.070%), Zimbabwean (15.6%, a difference of 0.080%), and Basque (15.5%, a difference of 0.14%).
| Demographics | Rating | Rank | Single Father Poverty |
| Brazilians | 99.0 /100 | #87 | Exceptional 15.5% |
| Burmese | 99.0 /100 | #88 | Exceptional 15.5% |
| Immigrants | Korea | 99.0 /100 | #89 | Exceptional 15.5% |
| Mexican American Indians | 98.7 /100 | #90 | Exceptional 15.5% |
| Immigrants | Romania | 98.6 /100 | #91 | Exceptional 15.5% |
| Immigrants | Serbia | 98.5 /100 | #92 | Exceptional 15.5% |
| Basques | 98.4 /100 | #93 | Exceptional 15.5% |
| Immigrants | Uruguay | 98.2 /100 | #94 | Exceptional 15.6% |
| Immigrants | Kazakhstan | 98.2 /100 | #95 | Exceptional 15.6% |
| Immigrants | Belgium | 98.1 /100 | #96 | Exceptional 15.6% |
| Yaqui | 98.1 /100 | #97 | Exceptional 15.6% |
| Zimbabweans | 98.1 /100 | #98 | Exceptional 15.6% |
| Immigrants | Middle Africa | 97.4 /100 | #99 | Exceptional 15.6% |
| Immigrants | Chile | 96.9 /100 | #100 | Exceptional 15.7% |
| Fijians | 96.8 /100 | #101 | Exceptional 15.7% |