Celtic vs Immigrants from Switzerland Vision Disability
COMPARE
Celtic
Immigrants from Switzerland
Vision Disability
Vision Disability Comparison
Celtics
Immigrants from Switzerland
2.4%
VISION DISABILITY
0.1/ 100
METRIC RATING
269th/ 347
METRIC RANK
2.0%
VISION DISABILITY
97.0/ 100
METRIC RATING
87th/ 347
METRIC RANK
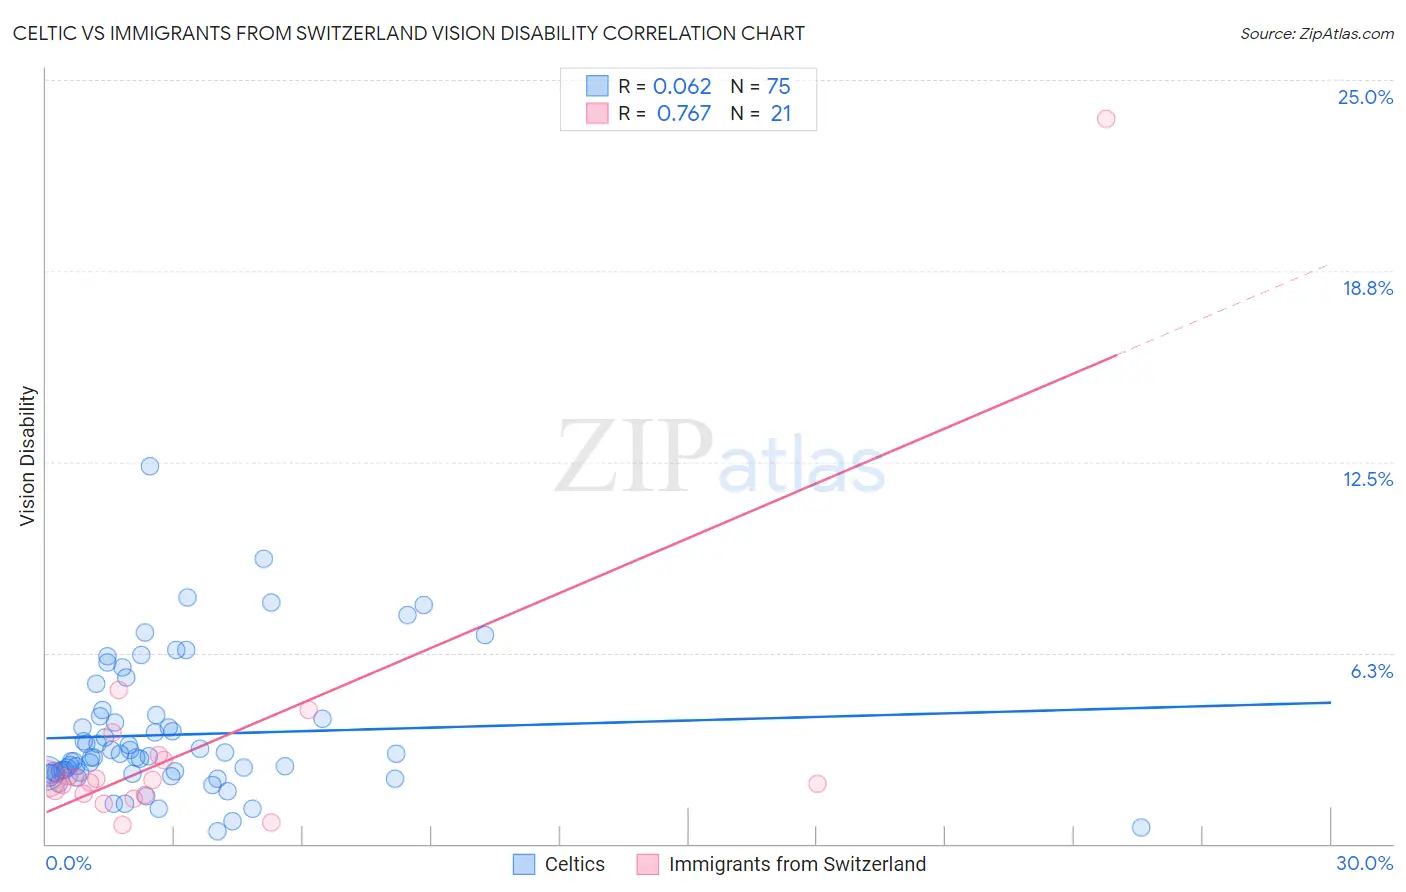
Celtic vs Immigrants from Switzerland Vision Disability Correlation Chart
The statistical analysis conducted on geographies consisting of 168,807,792 people shows a slight positive correlation between the proportion of Celtics and percentage of population with vision disability in the United States with a correlation coefficient (R) of 0.062 and weighted average of 2.4%. Similarly, the statistical analysis conducted on geographies consisting of 148,059,339 people shows a strong positive correlation between the proportion of Immigrants from Switzerland and percentage of population with vision disability in the United States with a correlation coefficient (R) of 0.767 and weighted average of 2.0%, a difference of 17.6%.
Vision Disability Correlation Summary
| Measurement | Celtic | Immigrants from Switzerland |
| Minimum | 0.40% | 0.59% |
| Maximum | 12.3% | 23.7% |
| Range | 11.9% | 23.1% |
| Mean | 3.6% | 3.2% |
| Median | 2.8% | 2.1% |
| Interquartile 25% (IQ1) | 2.3% | 1.6% |
| Interquartile 75% (IQ3) | 4.2% | 2.8% |
| Interquartile Range (IQR) | 1.9% | 1.2% |
| Standard Deviation (Sample) | 2.2% | 4.8% |
| Standard Deviation (Population) | 2.2% | 4.7% |
Similar Demographics by Vision Disability
Demographics Similar to Celtics by Vision Disability
In terms of vision disability, the demographic groups most similar to Celtics are Cuban (2.4%, a difference of 0.010%), Immigrants from the Azores (2.4%, a difference of 0.16%), Senegalese (2.4%, a difference of 0.27%), Spaniard (2.4%, a difference of 0.27%), and Ute (2.4%, a difference of 0.36%).
| Demographics | Rating | Rank | Vision Disability |
| Jamaicans | 0.1 /100 | #262 | Tragic 2.4% |
| Immigrants | Belize | 0.1 /100 | #263 | Tragic 2.4% |
| Immigrants | Liberia | 0.1 /100 | #264 | Tragic 2.4% |
| Immigrants | Jamaica | 0.1 /100 | #265 | Tragic 2.4% |
| Mexican American Indians | 0.1 /100 | #266 | Tragic 2.4% |
| Ute | 0.1 /100 | #267 | Tragic 2.4% |
| Senegalese | 0.1 /100 | #268 | Tragic 2.4% |
| Celtics | 0.1 /100 | #269 | Tragic 2.4% |
| Cubans | 0.1 /100 | #270 | Tragic 2.4% |
| Immigrants | Azores | 0.1 /100 | #271 | Tragic 2.4% |
| Spaniards | 0.1 /100 | #272 | Tragic 2.4% |
| Immigrants | Bahamas | 0.1 /100 | #273 | Tragic 2.4% |
| Immigrants | Latin America | 0.0 /100 | #274 | Tragic 2.4% |
| Chippewa | 0.0 /100 | #275 | Tragic 2.4% |
| Scotch-Irish | 0.0 /100 | #276 | Tragic 2.4% |
Demographics Similar to Immigrants from Switzerland by Vision Disability
In terms of vision disability, the demographic groups most similar to Immigrants from Switzerland are Norwegian (2.0%, a difference of 0.010%), Immigrants from Eastern Africa (2.0%, a difference of 0.050%), Immigrants from Moldova (2.0%, a difference of 0.060%), Chinese (2.0%, a difference of 0.090%), and Immigrants from Latvia (2.0%, a difference of 0.14%).
| Demographics | Rating | Rank | Vision Disability |
| Lithuanians | 97.7 /100 | #80 | Exceptional 2.0% |
| Soviet Union | 97.6 /100 | #81 | Exceptional 2.0% |
| Immigrants | Poland | 97.6 /100 | #82 | Exceptional 2.0% |
| Immigrants | Western Asia | 97.5 /100 | #83 | Exceptional 2.0% |
| Immigrants | Latvia | 97.3 /100 | #84 | Exceptional 2.0% |
| Chinese | 97.2 /100 | #85 | Exceptional 2.0% |
| Immigrants | Moldova | 97.2 /100 | #86 | Exceptional 2.0% |
| Immigrants | Switzerland | 97.0 /100 | #87 | Exceptional 2.0% |
| Norwegians | 97.0 /100 | #88 | Exceptional 2.0% |
| Immigrants | Eastern Africa | 97.0 /100 | #89 | Exceptional 2.0% |
| Immigrants | Lebanon | 96.7 /100 | #90 | Exceptional 2.1% |
| Immigrants | Somalia | 96.2 /100 | #91 | Exceptional 2.1% |
| Immigrants | Syria | 96.2 /100 | #92 | Exceptional 2.1% |
| Immigrants | Europe | 96.1 /100 | #93 | Exceptional 2.1% |
| Immigrants | Croatia | 96.0 /100 | #94 | Exceptional 2.1% |