Celtic vs Immigrants from Germany In Labor Force | Age 16-19
COMPARE
Celtic
Immigrants from Germany
In Labor Force | Age 16-19
In Labor Force | Age 16-19 Comparison
Celtics
Immigrants from Germany
41.3%
IN LABOR FORCE | AGE 16-19
100.0/ 100
METRIC RATING
41st/ 347
METRIC RANK
39.1%
IN LABOR FORCE | AGE 16-19
99.6/ 100
METRIC RATING
87th/ 347
METRIC RANK
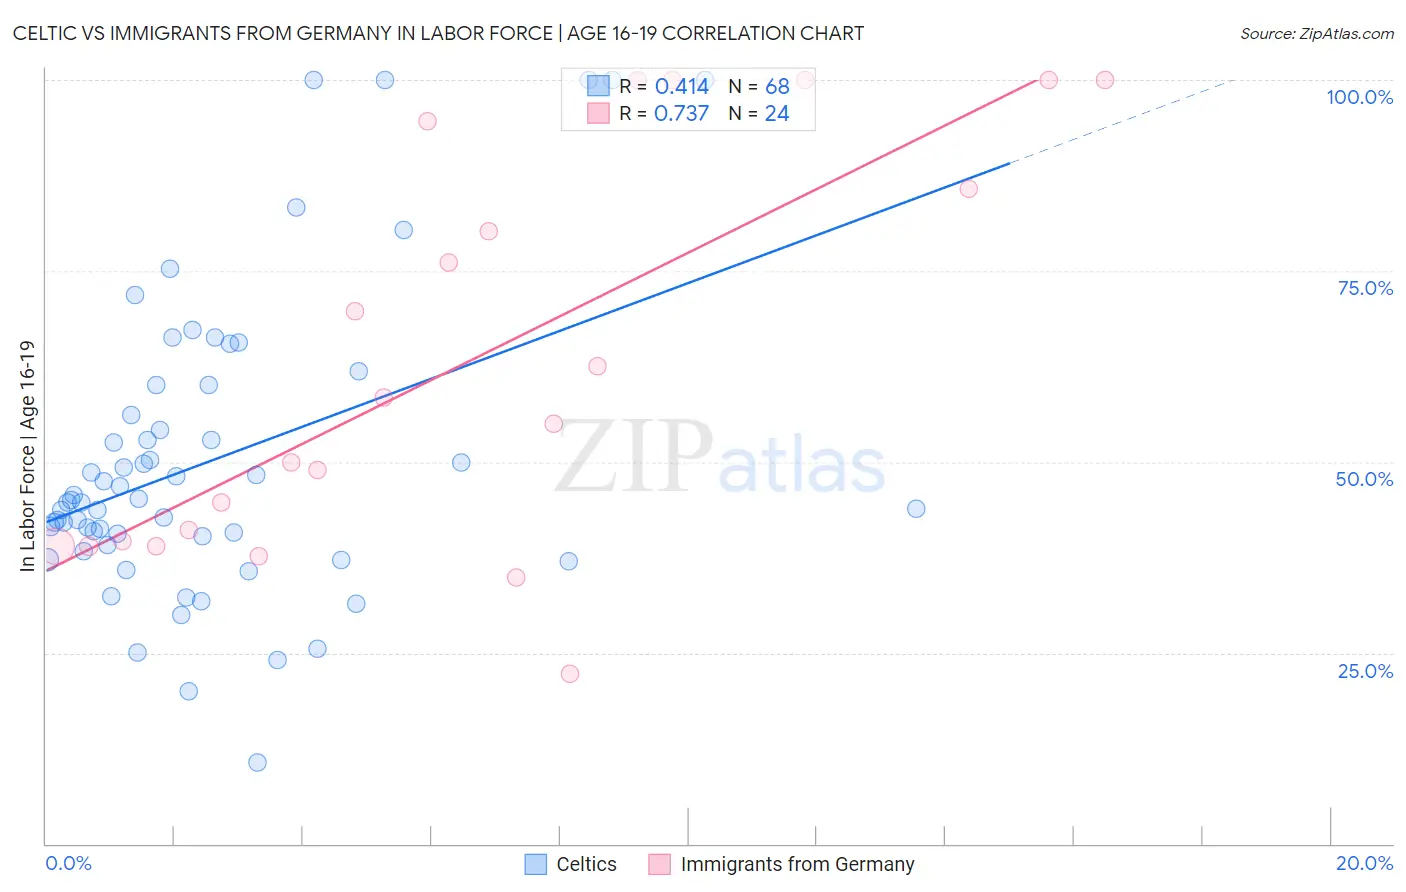
Celtic vs Immigrants from Germany In Labor Force | Age 16-19 Correlation Chart
The statistical analysis conducted on geographies consisting of 168,748,134 people shows a moderate positive correlation between the proportion of Celtics and labor force participation rate among population between the ages 16 and 19 in the United States with a correlation coefficient (R) of 0.414 and weighted average of 41.3%. Similarly, the statistical analysis conducted on geographies consisting of 462,642,195 people shows a strong positive correlation between the proportion of Immigrants from Germany and labor force participation rate among population between the ages 16 and 19 in the United States with a correlation coefficient (R) of 0.737 and weighted average of 39.1%, a difference of 5.6%.
In Labor Force | Age 16-19 Correlation Summary
| Measurement | Celtic | Immigrants from Germany |
| Minimum | 10.6% | 22.2% |
| Maximum | 100.0% | 100.0% |
| Range | 89.4% | 77.8% |
| Mean | 50.1% | 63.2% |
| Median | 44.9% | 56.7% |
| Interquartile 25% (IQ1) | 39.6% | 39.3% |
| Interquartile 75% (IQ3) | 58.1% | 90.1% |
| Interquartile Range (IQR) | 18.5% | 50.8% |
| Standard Deviation (Sample) | 19.6% | 26.0% |
| Standard Deviation (Population) | 19.4% | 25.4% |
Similar Demographics by In Labor Force | Age 16-19
Demographics Similar to Celtics by In Labor Force | Age 16-19
In terms of in labor force | age 16-19, the demographic groups most similar to Celtics are White/Caucasian (41.3%, a difference of 0.010%), Tongan (41.2%, a difference of 0.31%), Immigrants from Liberia (41.5%, a difference of 0.34%), European (41.1%, a difference of 0.42%), and Scotch-Irish (41.5%, a difference of 0.44%).
| Demographics | Rating | Rank | In Labor Force | Age 16-19 |
| Immigrants | Bosnia and Herzegovina | 100.0 /100 | #34 | Exceptional 41.8% |
| Yugoslavians | 100.0 /100 | #35 | Exceptional 41.8% |
| Immigrants | Azores | 100.0 /100 | #36 | Exceptional 41.7% |
| Immigrants | Congo | 100.0 /100 | #37 | Exceptional 41.7% |
| Sioux | 100.0 /100 | #38 | Exceptional 41.5% |
| Scotch-Irish | 100.0 /100 | #39 | Exceptional 41.5% |
| Immigrants | Liberia | 100.0 /100 | #40 | Exceptional 41.5% |
| Celtics | 100.0 /100 | #41 | Exceptional 41.3% |
| Whites/Caucasians | 100.0 /100 | #42 | Exceptional 41.3% |
| Tongans | 100.0 /100 | #43 | Exceptional 41.2% |
| Europeans | 100.0 /100 | #44 | Exceptional 41.1% |
| Croatians | 100.0 /100 | #45 | Exceptional 41.1% |
| Immigrants | Sudan | 100.0 /100 | #46 | Exceptional 41.0% |
| Carpatho Rusyns | 100.0 /100 | #47 | Exceptional 40.8% |
| Icelanders | 100.0 /100 | #48 | Exceptional 40.8% |
Demographics Similar to Immigrants from Germany by In Labor Force | Age 16-19
In terms of in labor force | age 16-19, the demographic groups most similar to Immigrants from Germany are Puget Sound Salish (39.1%, a difference of 0.070%), Samoan (39.1%, a difference of 0.080%), Alaska Native (39.1%, a difference of 0.080%), Creek (39.1%, a difference of 0.10%), and Immigrants from Burma/Myanmar (39.0%, a difference of 0.16%).
| Demographics | Rating | Rank | In Labor Force | Age 16-19 |
| Immigrants | Iraq | 99.8 /100 | #80 | Exceptional 39.4% |
| Shoshone | 99.7 /100 | #81 | Exceptional 39.3% |
| Basques | 99.7 /100 | #82 | Exceptional 39.3% |
| Spanish | 99.7 /100 | #83 | Exceptional 39.3% |
| Immigrants | Uganda | 99.7 /100 | #84 | Exceptional 39.2% |
| Creek | 99.6 /100 | #85 | Exceptional 39.1% |
| Samoans | 99.6 /100 | #86 | Exceptional 39.1% |
| Immigrants | Germany | 99.6 /100 | #87 | Exceptional 39.1% |
| Puget Sound Salish | 99.6 /100 | #88 | Exceptional 39.1% |
| Alaska Natives | 99.6 /100 | #89 | Exceptional 39.1% |
| Immigrants | Burma/Myanmar | 99.5 /100 | #90 | Exceptional 39.0% |
| Spanish Americans | 99.5 /100 | #91 | Exceptional 39.0% |
| Osage | 99.4 /100 | #92 | Exceptional 39.0% |
| Blackfeet | 99.4 /100 | #93 | Exceptional 38.9% |
| Immigrants | Canada | 99.4 /100 | #94 | Exceptional 38.9% |