Cypriot vs Cree Single Female Poverty
COMPARE
Cypriot
Cree
Single Female Poverty
Single Female Poverty Comparison
Cypriots
Cree
19.2%
SINGLE FEMALE POVERTY
99.6/ 100
METRIC RATING
65th/ 347
METRIC RANK
24.1%
SINGLE FEMALE POVERTY
0.0/ 100
METRIC RATING
286th/ 347
METRIC RANK
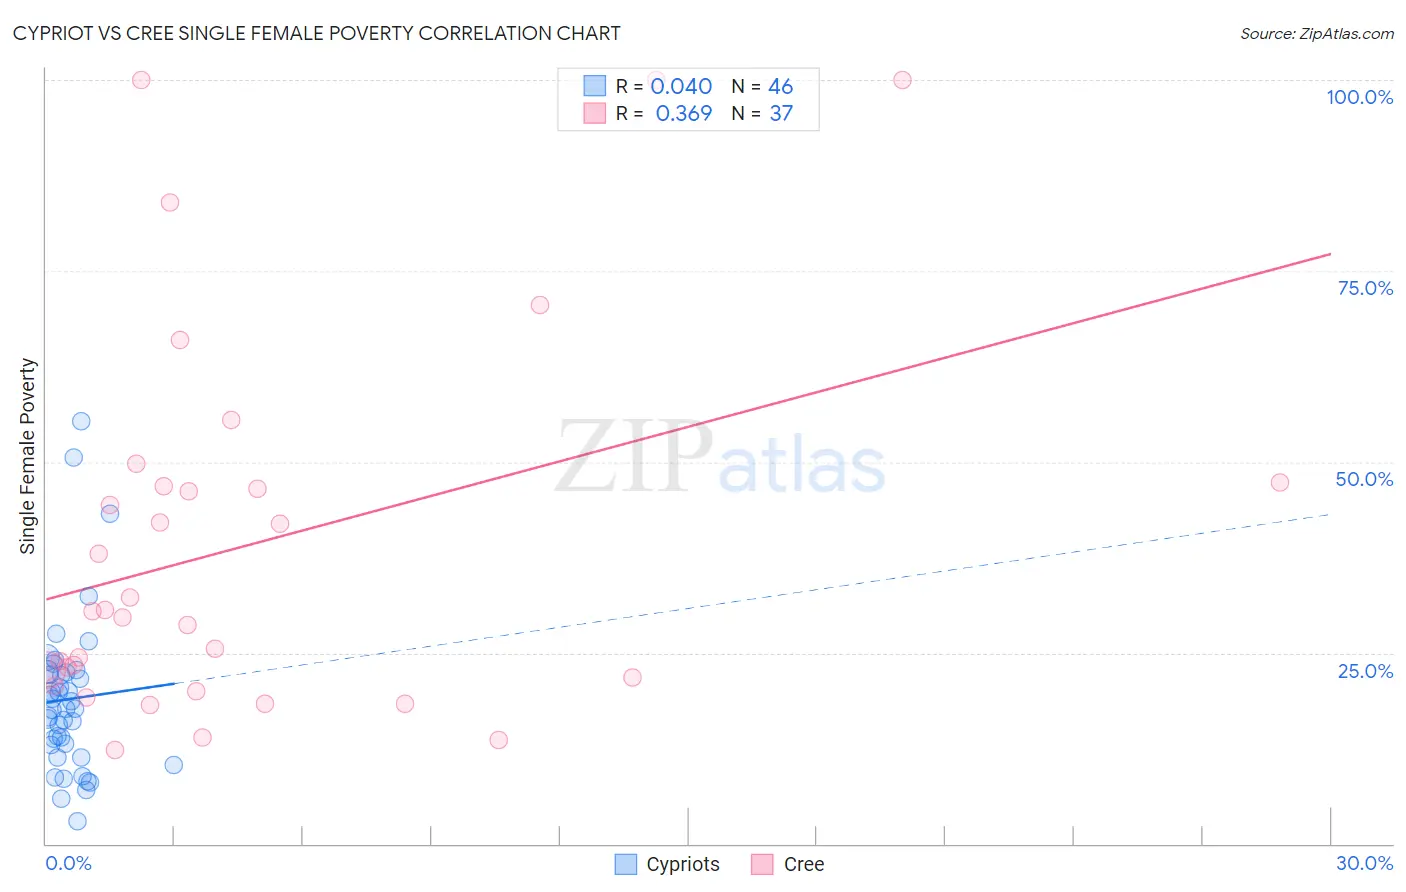
Cypriot vs Cree Single Female Poverty Correlation Chart
The statistical analysis conducted on geographies consisting of 61,401,008 people shows no correlation between the proportion of Cypriots and poverty level among single females in the United States with a correlation coefficient (R) of 0.040 and weighted average of 19.2%. Similarly, the statistical analysis conducted on geographies consisting of 75,960,780 people shows a mild positive correlation between the proportion of Cree and poverty level among single females in the United States with a correlation coefficient (R) of 0.369 and weighted average of 24.1%, a difference of 25.4%.
Single Female Poverty Correlation Summary
| Measurement | Cypriot | Cree |
| Minimum | 2.9% | 12.2% |
| Maximum | 55.3% | 100.0% |
| Range | 52.4% | 87.8% |
| Mean | 18.9% | 39.2% |
| Median | 17.7% | 30.5% |
| Interquartile 25% (IQ1) | 13.0% | 21.2% |
| Interquartile 75% (IQ3) | 22.5% | 47.1% |
| Interquartile Range (IQR) | 9.5% | 25.9% |
| Standard Deviation (Sample) | 10.4% | 24.7% |
| Standard Deviation (Population) | 10.3% | 24.4% |
Similar Demographics by Single Female Poverty
Demographics Similar to Cypriots by Single Female Poverty
In terms of single female poverty, the demographic groups most similar to Cypriots are Palestinian (19.2%, a difference of 0.020%), Immigrants from Northern Europe (19.2%, a difference of 0.030%), Immigrants from Europe (19.2%, a difference of 0.030%), Immigrants from Egypt (19.2%, a difference of 0.060%), and Laotian (19.3%, a difference of 0.10%).
| Demographics | Rating | Rank | Single Female Poverty |
| Immigrants | Bulgaria | 99.7 /100 | #58 | Exceptional 19.1% |
| Sri Lankans | 99.6 /100 | #59 | Exceptional 19.2% |
| Russians | 99.6 /100 | #60 | Exceptional 19.2% |
| Cambodians | 99.6 /100 | #61 | Exceptional 19.2% |
| Lithuanians | 99.6 /100 | #62 | Exceptional 19.2% |
| Immigrants | Northern Europe | 99.6 /100 | #63 | Exceptional 19.2% |
| Immigrants | Europe | 99.6 /100 | #64 | Exceptional 19.2% |
| Cypriots | 99.6 /100 | #65 | Exceptional 19.2% |
| Palestinians | 99.6 /100 | #66 | Exceptional 19.2% |
| Immigrants | Egypt | 99.6 /100 | #67 | Exceptional 19.2% |
| Laotians | 99.5 /100 | #68 | Exceptional 19.3% |
| Paraguayans | 99.5 /100 | #69 | Exceptional 19.3% |
| Immigrants | Jordan | 99.4 /100 | #70 | Exceptional 19.3% |
| Immigrants | South Eastern Asia | 99.4 /100 | #71 | Exceptional 19.3% |
| Immigrants | Latvia | 99.4 /100 | #72 | Exceptional 19.3% |
Demographics Similar to Cree by Single Female Poverty
In terms of single female poverty, the demographic groups most similar to Cree are Immigrants from Guatemala (24.1%, a difference of 0.040%), Bangladeshi (24.2%, a difference of 0.15%), Spanish American (24.2%, a difference of 0.17%), U.S. Virgin Islander (24.2%, a difference of 0.22%), and Indonesian (24.3%, a difference of 0.57%).
| Demographics | Rating | Rank | Single Female Poverty |
| Alaskan Athabascans | 0.0 /100 | #279 | Tragic 23.6% |
| Immigrants | Latin America | 0.0 /100 | #280 | Tragic 23.7% |
| Immigrants | Zaire | 0.0 /100 | #281 | Tragic 23.8% |
| Guatemalans | 0.0 /100 | #282 | Tragic 23.8% |
| German Russians | 0.0 /100 | #283 | Tragic 23.9% |
| Immigrants | Dominica | 0.0 /100 | #284 | Tragic 23.9% |
| Immigrants | Guatemala | 0.0 /100 | #285 | Tragic 24.1% |
| Cree | 0.0 /100 | #286 | Tragic 24.1% |
| Bangladeshis | 0.0 /100 | #287 | Tragic 24.2% |
| Spanish Americans | 0.0 /100 | #288 | Tragic 24.2% |
| U.S. Virgin Islanders | 0.0 /100 | #289 | Tragic 24.2% |
| Indonesians | 0.0 /100 | #290 | Tragic 24.3% |
| Osage | 0.0 /100 | #291 | Tragic 24.4% |
| Alsatians | 0.0 /100 | #292 | Tragic 24.5% |
| Americans | 0.0 /100 | #293 | Tragic 24.5% |