Celtic vs Cree Seniors Poverty Over the Age of 75
COMPARE
Celtic
Cree
Seniors Poverty Over the Age of 75
Seniors Poverty Over the Age of 75 Comparison
Celtics
Cree
11.0%
SENIORS POVERTY OVER THE AGE OF 75
99.1/ 100
METRIC RATING
43rd/ 347
METRIC RANK
13.1%
SENIORS POVERTY OVER THE AGE OF 75
2.3/ 100
METRIC RATING
227th/ 347
METRIC RANK
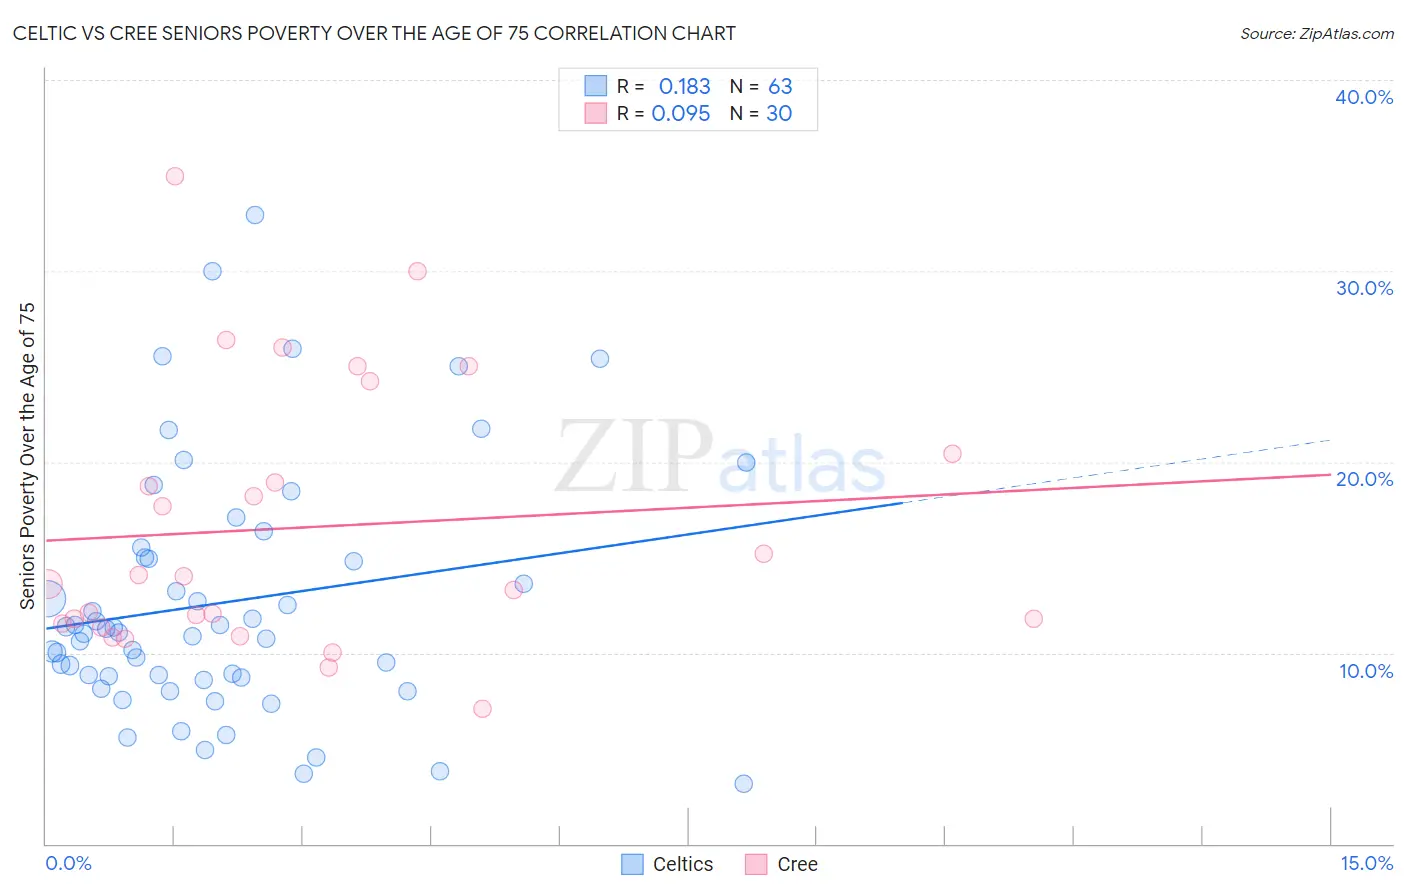
Celtic vs Cree Seniors Poverty Over the Age of 75 Correlation Chart
The statistical analysis conducted on geographies consisting of 167,925,016 people shows a poor positive correlation between the proportion of Celtics and poverty level among seniors over the age of 75 in the United States with a correlation coefficient (R) of 0.183 and weighted average of 11.0%. Similarly, the statistical analysis conducted on geographies consisting of 75,969,190 people shows a slight positive correlation between the proportion of Cree and poverty level among seniors over the age of 75 in the United States with a correlation coefficient (R) of 0.095 and weighted average of 13.1%, a difference of 19.1%.
Seniors Poverty Over the Age of 75 Correlation Summary
| Measurement | Celtic | Cree |
| Minimum | 3.2% | 7.1% |
| Maximum | 32.9% | 35.0% |
| Range | 29.8% | 27.9% |
| Mean | 12.6% | 16.6% |
| Median | 11.1% | 13.8% |
| Interquartile 25% (IQ1) | 8.7% | 11.5% |
| Interquartile 75% (IQ3) | 15.0% | 20.5% |
| Interquartile Range (IQR) | 6.3% | 8.9% |
| Standard Deviation (Sample) | 6.5% | 7.0% |
| Standard Deviation (Population) | 6.4% | 6.9% |
Similar Demographics by Seniors Poverty Over the Age of 75
Demographics Similar to Celtics by Seniors Poverty Over the Age of 75
In terms of seniors poverty over the age of 75, the demographic groups most similar to Celtics are Belgian (11.0%, a difference of 0.030%), Austrian (11.0%, a difference of 0.050%), Carpatho Rusyn (11.1%, a difference of 0.30%), Immigrants from Lithuania (11.0%, a difference of 0.32%), and Greek (11.1%, a difference of 0.36%).
| Demographics | Rating | Rank | Seniors Poverty Over the Age of 75 |
| Scotch-Irish | 99.6 /100 | #36 | Exceptional 10.8% |
| Latvians | 99.6 /100 | #37 | Exceptional 10.8% |
| Finns | 99.6 /100 | #38 | Exceptional 10.8% |
| Czechoslovakians | 99.4 /100 | #39 | Exceptional 10.9% |
| Thais | 99.4 /100 | #40 | Exceptional 10.9% |
| Immigrants | Lithuania | 99.2 /100 | #41 | Exceptional 11.0% |
| Austrians | 99.1 /100 | #42 | Exceptional 11.0% |
| Celtics | 99.1 /100 | #43 | Exceptional 11.0% |
| Belgians | 99.1 /100 | #44 | Exceptional 11.0% |
| Carpatho Rusyns | 99.0 /100 | #45 | Exceptional 11.1% |
| Greeks | 99.0 /100 | #46 | Exceptional 11.1% |
| Hawaiians | 98.8 /100 | #47 | Exceptional 11.1% |
| French | 98.7 /100 | #48 | Exceptional 11.1% |
| Samoans | 98.7 /100 | #49 | Exceptional 11.1% |
| Serbians | 98.6 /100 | #50 | Exceptional 11.1% |
Demographics Similar to Cree by Seniors Poverty Over the Age of 75
In terms of seniors poverty over the age of 75, the demographic groups most similar to Cree are Shoshone (13.1%, a difference of 0.26%), Israeli (13.2%, a difference of 0.28%), Immigrants from Morocco (13.1%, a difference of 0.42%), Chippewa (13.1%, a difference of 0.49%), and Immigrants from Nigeria (13.0%, a difference of 0.69%).
| Demographics | Rating | Rank | Seniors Poverty Over the Age of 75 |
| Seminole | 4.5 /100 | #220 | Tragic 12.9% |
| Immigrants | Kazakhstan | 4.3 /100 | #221 | Tragic 13.0% |
| Nigerians | 3.4 /100 | #222 | Tragic 13.0% |
| Immigrants | Nigeria | 3.3 /100 | #223 | Tragic 13.0% |
| Chippewa | 2.9 /100 | #224 | Tragic 13.1% |
| Immigrants | Morocco | 2.8 /100 | #225 | Tragic 13.1% |
| Shoshone | 2.6 /100 | #226 | Tragic 13.1% |
| Cree | 2.3 /100 | #227 | Tragic 13.1% |
| Israelis | 2.0 /100 | #228 | Tragic 13.2% |
| Somalis | 1.6 /100 | #229 | Tragic 13.2% |
| Immigrants | China | 1.5 /100 | #230 | Tragic 13.2% |
| Sub-Saharan Africans | 1.5 /100 | #231 | Tragic 13.2% |
| Immigrants | Chile | 1.3 /100 | #232 | Tragic 13.3% |
| Immigrants | Costa Rica | 1.3 /100 | #233 | Tragic 13.3% |
| Immigrants | Israel | 1.1 /100 | #234 | Tragic 13.3% |