Celtic vs Cree College, Under 1 year
COMPARE
Celtic
Cree
College, Under 1 year
College, Under 1 year Comparison
Celtics
Cree
65.9%
COLLEGE, UNDER 1 YEAR
67.3/ 100
METRIC RATING
158th/ 347
METRIC RANK
63.3%
COLLEGE, UNDER 1 YEAR
5.2/ 100
METRIC RATING
221st/ 347
METRIC RANK
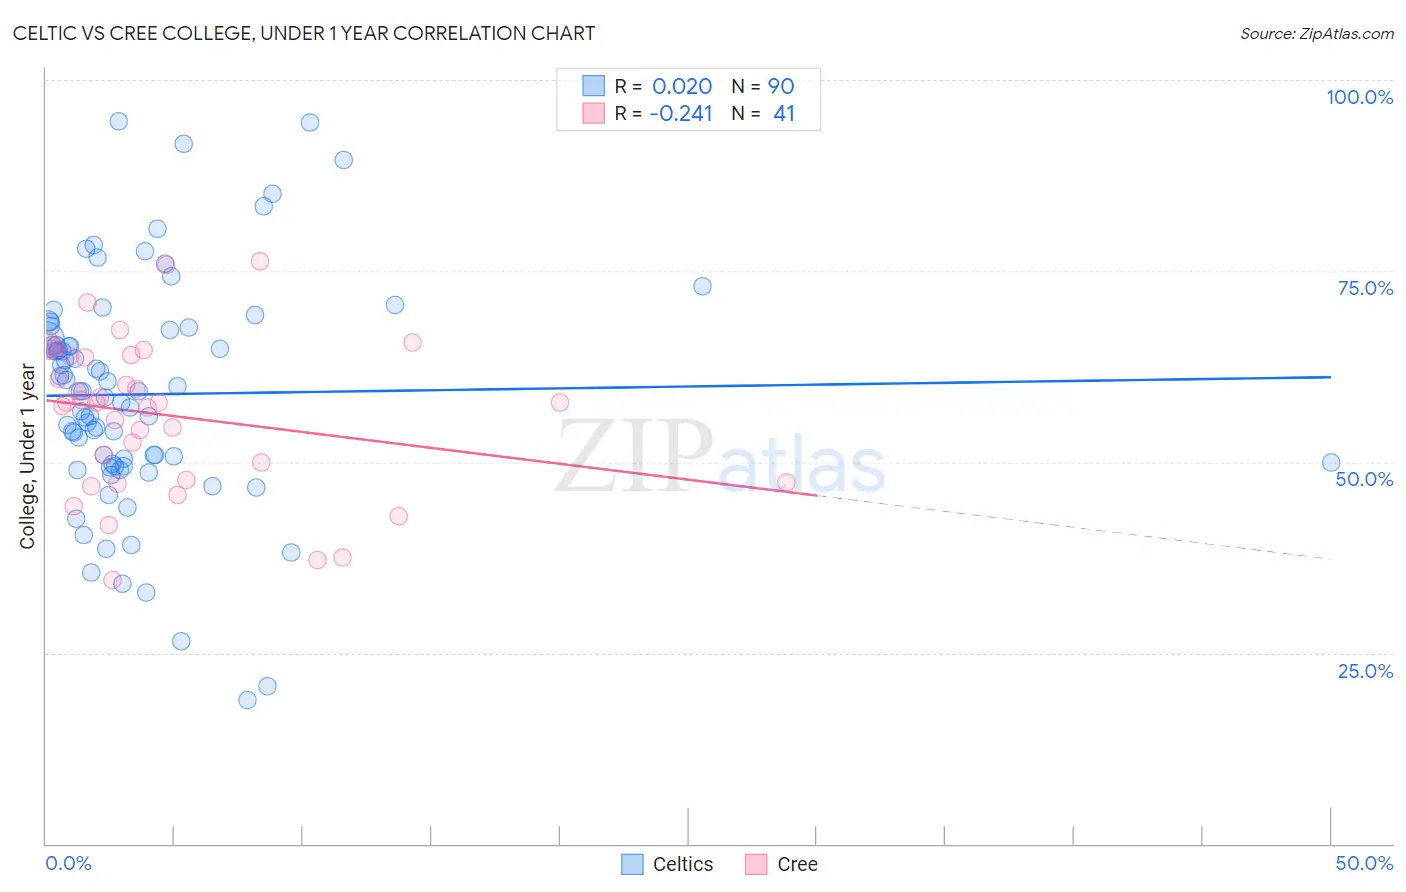
Celtic vs Cree College, Under 1 year Correlation Chart
The statistical analysis conducted on geographies consisting of 168,877,347 people shows no correlation between the proportion of Celtics and percentage of population with at least college, under 1 year education in the United States with a correlation coefficient (R) of 0.020 and weighted average of 65.9%. Similarly, the statistical analysis conducted on geographies consisting of 76,211,744 people shows a weak negative correlation between the proportion of Cree and percentage of population with at least college, under 1 year education in the United States with a correlation coefficient (R) of -0.241 and weighted average of 63.3%, a difference of 4.1%.
College, Under 1 year Correlation Summary
| Measurement | Celtic | Cree |
| Minimum | 18.7% | 34.5% |
| Maximum | 94.6% | 76.2% |
| Range | 75.9% | 41.7% |
| Mean | 58.8% | 56.1% |
| Median | 59.3% | 57.7% |
| Interquartile 25% (IQ1) | 49.8% | 47.5% |
| Interquartile 75% (IQ3) | 67.2% | 63.9% |
| Interquartile Range (IQR) | 17.4% | 16.4% |
| Standard Deviation (Sample) | 14.9% | 10.0% |
| Standard Deviation (Population) | 14.8% | 9.9% |
Similar Demographics by College, Under 1 year
Demographics Similar to Celtics by College, Under 1 year
In terms of college, under 1 year, the demographic groups most similar to Celtics are Sierra Leonean (66.0%, a difference of 0.030%), Tlingit-Haida (65.9%, a difference of 0.050%), Albanian (65.9%, a difference of 0.060%), Brazilian (65.9%, a difference of 0.070%), and Korean (65.9%, a difference of 0.10%).
| Demographics | Rating | Rank | College, Under 1 year |
| Immigrants | Sudan | 76.0 /100 | #151 | Good 66.2% |
| Sudanese | 74.1 /100 | #152 | Good 66.2% |
| Belgians | 73.7 /100 | #153 | Good 66.2% |
| Immigrants | Eritrea | 71.9 /100 | #154 | Good 66.1% |
| Irish | 70.3 /100 | #155 | Good 66.0% |
| Welsh | 69.9 /100 | #156 | Good 66.0% |
| Sierra Leoneans | 67.8 /100 | #157 | Good 66.0% |
| Celtics | 67.3 /100 | #158 | Good 65.9% |
| Tlingit-Haida | 66.4 /100 | #159 | Good 65.9% |
| Albanians | 66.1 /100 | #160 | Good 65.9% |
| Brazilians | 66.0 /100 | #161 | Good 65.9% |
| Koreans | 65.3 /100 | #162 | Good 65.9% |
| Somalis | 62.7 /100 | #163 | Good 65.8% |
| Czechoslovakians | 62.6 /100 | #164 | Good 65.8% |
| Immigrants | Uzbekistan | 61.6 /100 | #165 | Good 65.8% |
Demographics Similar to Cree by College, Under 1 year
In terms of college, under 1 year, the demographic groups most similar to Cree are Immigrants from Senegal (63.3%, a difference of 0.050%), Portuguese (63.4%, a difference of 0.090%), Immigrants from Panama (63.4%, a difference of 0.11%), Immigrants from Fiji (63.4%, a difference of 0.11%), and Immigrants from Uruguay (63.4%, a difference of 0.14%).
| Demographics | Rating | Rank | College, Under 1 year |
| Immigrants | Nigeria | 8.8 /100 | #214 | Tragic 63.7% |
| Senegalese | 7.7 /100 | #215 | Tragic 63.6% |
| Hmong | 6.8 /100 | #216 | Tragic 63.5% |
| Immigrants | Uruguay | 5.8 /100 | #217 | Tragic 63.4% |
| Immigrants | Panama | 5.7 /100 | #218 | Tragic 63.4% |
| Immigrants | Fiji | 5.7 /100 | #219 | Tragic 63.4% |
| Portuguese | 5.6 /100 | #220 | Tragic 63.4% |
| Cree | 5.2 /100 | #221 | Tragic 63.3% |
| Immigrants | Senegal | 5.0 /100 | #222 | Tragic 63.3% |
| Immigrants | Costa Rica | 4.5 /100 | #223 | Tragic 63.2% |
| Sub-Saharan Africans | 4.4 /100 | #224 | Tragic 63.2% |
| Immigrants | Peru | 4.0 /100 | #225 | Tragic 63.1% |
| Immigrants | Colombia | 4.0 /100 | #226 | Tragic 63.1% |
| Immigrants | Ghana | 3.7 /100 | #227 | Tragic 63.1% |
| Samoans | 3.3 /100 | #228 | Tragic 63.0% |