Canadian vs Immigrants from Hungary Hearing Disability
COMPARE
Canadian
Immigrants from Hungary
Hearing Disability
Hearing Disability Comparison
Canadians
Immigrants from Hungary
3.5%
HEARING DISABILITY
0.1/ 100
METRIC RATING
267th/ 347
METRIC RANK
3.1%
HEARING DISABILITY
12.5/ 100
METRIC RATING
209th/ 347
METRIC RANK
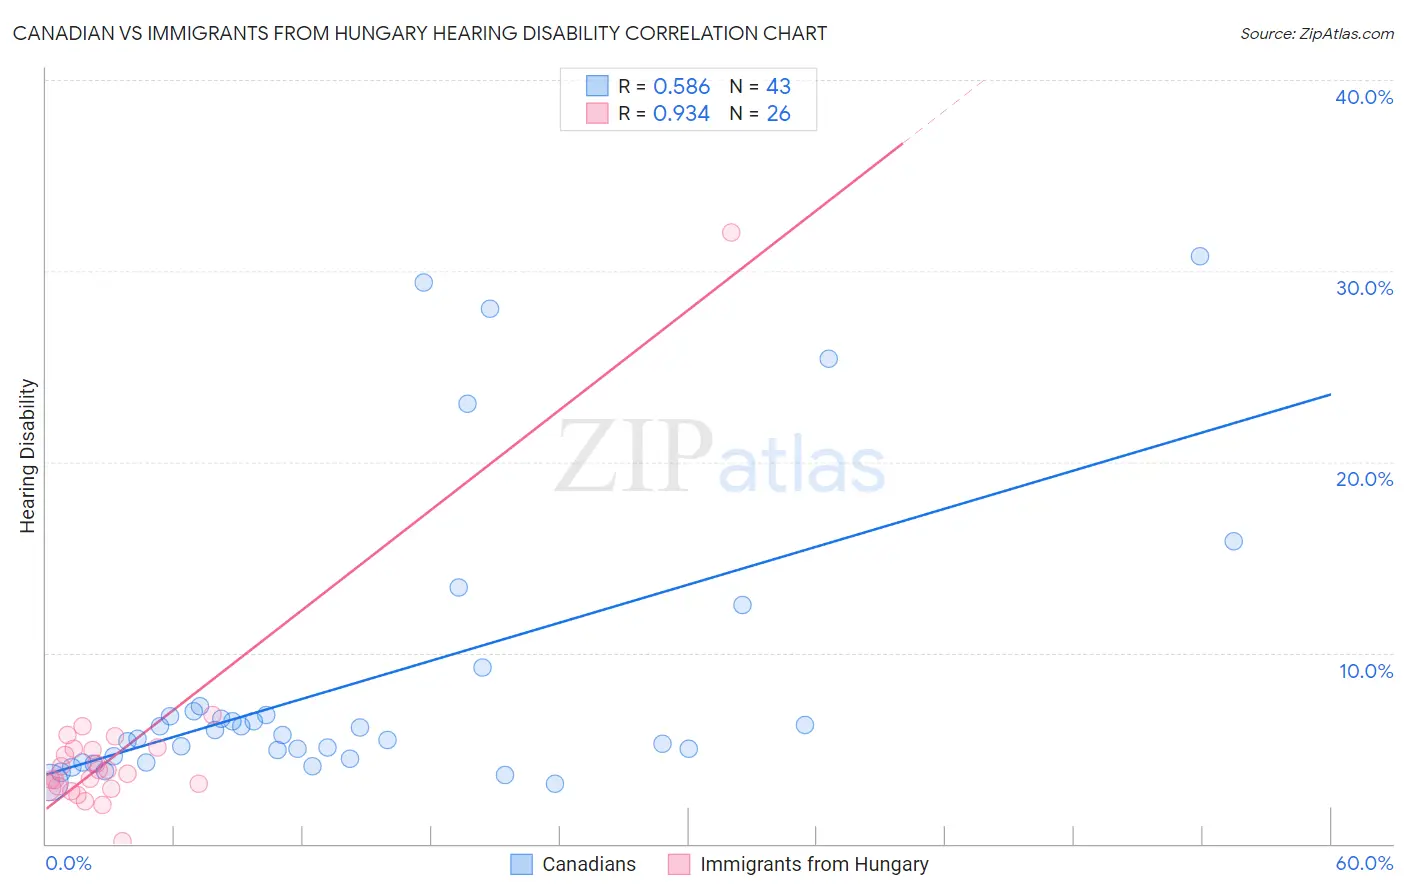
Canadian vs Immigrants from Hungary Hearing Disability Correlation Chart
The statistical analysis conducted on geographies consisting of 437,359,383 people shows a substantial positive correlation between the proportion of Canadians and percentage of population with hearing disability in the United States with a correlation coefficient (R) of 0.586 and weighted average of 3.5%. Similarly, the statistical analysis conducted on geographies consisting of 195,680,611 people shows a near-perfect positive correlation between the proportion of Immigrants from Hungary and percentage of population with hearing disability in the United States with a correlation coefficient (R) of 0.934 and weighted average of 3.1%, a difference of 11.4%.
Hearing Disability Correlation Summary
| Measurement | Canadian | Immigrants from Hungary |
| Minimum | 3.1% | 0.15% |
| Maximum | 30.8% | 32.0% |
| Range | 27.6% | 31.9% |
| Mean | 8.5% | 4.9% |
| Median | 5.7% | 3.8% |
| Interquartile 25% (IQ1) | 4.4% | 2.9% |
| Interquartile 75% (IQ3) | 6.9% | 5.0% |
| Interquartile Range (IQR) | 2.5% | 2.0% |
| Standard Deviation (Sample) | 7.4% | 5.7% |
| Standard Deviation (Population) | 7.3% | 5.6% |
Similar Demographics by Hearing Disability
Demographics Similar to Canadians by Hearing Disability
In terms of hearing disability, the demographic groups most similar to Canadians are Spaniard (3.5%, a difference of 0.020%), Belgian (3.5%, a difference of 0.22%), Ute (3.5%, a difference of 0.32%), British (3.5%, a difference of 0.40%), and Immigrants from Germany (3.5%, a difference of 0.42%).
| Demographics | Rating | Rank | Hearing Disability |
| Portuguese | 0.1 /100 | #260 | Tragic 3.5% |
| Hawaiians | 0.1 /100 | #261 | Tragic 3.5% |
| Immigrants | North America | 0.1 /100 | #262 | Tragic 3.5% |
| Immigrants | Canada | 0.1 /100 | #263 | Tragic 3.5% |
| Immigrants | Germany | 0.1 /100 | #264 | Tragic 3.5% |
| British | 0.1 /100 | #265 | Tragic 3.5% |
| Belgians | 0.1 /100 | #266 | Tragic 3.5% |
| Canadians | 0.1 /100 | #267 | Tragic 3.5% |
| Spaniards | 0.1 /100 | #268 | Tragic 3.5% |
| Ute | 0.1 /100 | #269 | Tragic 3.5% |
| Europeans | 0.1 /100 | #270 | Tragic 3.5% |
| Czechs | 0.1 /100 | #271 | Tragic 3.5% |
| Fijians | 0.0 /100 | #272 | Tragic 3.5% |
| Puerto Ricans | 0.0 /100 | #273 | Tragic 3.5% |
| Swiss | 0.0 /100 | #274 | Tragic 3.5% |
Demographics Similar to Immigrants from Hungary by Hearing Disability
In terms of hearing disability, the demographic groups most similar to Immigrants from Hungary are Immigrants from Latvia (3.1%, a difference of 0.040%), Cape Verdean (3.1%, a difference of 0.050%), Romanian (3.1%, a difference of 0.080%), Pakistani (3.1%, a difference of 0.29%), and Immigrants from Iraq (3.1%, a difference of 0.44%).
| Demographics | Rating | Rank | Hearing Disability |
| Immigrants | Thailand | 16.4 /100 | #202 | Poor 3.1% |
| Immigrants | Denmark | 16.2 /100 | #203 | Poor 3.1% |
| Immigrants | Czechoslovakia | 15.9 /100 | #204 | Poor 3.1% |
| Alsatians | 15.9 /100 | #205 | Poor 3.1% |
| Eastern Europeans | 15.5 /100 | #206 | Poor 3.1% |
| Hispanics or Latinos | 15.1 /100 | #207 | Poor 3.1% |
| Immigrants | Latvia | 12.7 /100 | #208 | Poor 3.1% |
| Immigrants | Hungary | 12.5 /100 | #209 | Poor 3.1% |
| Cape Verdeans | 12.2 /100 | #210 | Poor 3.1% |
| Romanians | 12.1 /100 | #211 | Poor 3.1% |
| Pakistanis | 11.1 /100 | #212 | Poor 3.1% |
| Immigrants | Iraq | 10.5 /100 | #213 | Poor 3.1% |
| Australians | 8.1 /100 | #214 | Tragic 3.2% |
| Bangladeshis | 8.1 /100 | #215 | Tragic 3.2% |
| Immigrants | Norway | 7.3 /100 | #216 | Tragic 3.2% |