Puget Sound Salish vs Immigrants from Hungary Single Male Poverty
COMPARE
Puget Sound Salish
Immigrants from Hungary
Single Male Poverty
Single Male Poverty Comparison
Puget Sound Salish
Immigrants from Hungary
12.8%
SINGLE MALE POVERTY
54.3/ 100
METRIC RATING
169th/ 347
METRIC RANK
12.6%
SINGLE MALE POVERTY
71.9/ 100
METRIC RATING
151st/ 347
METRIC RANK
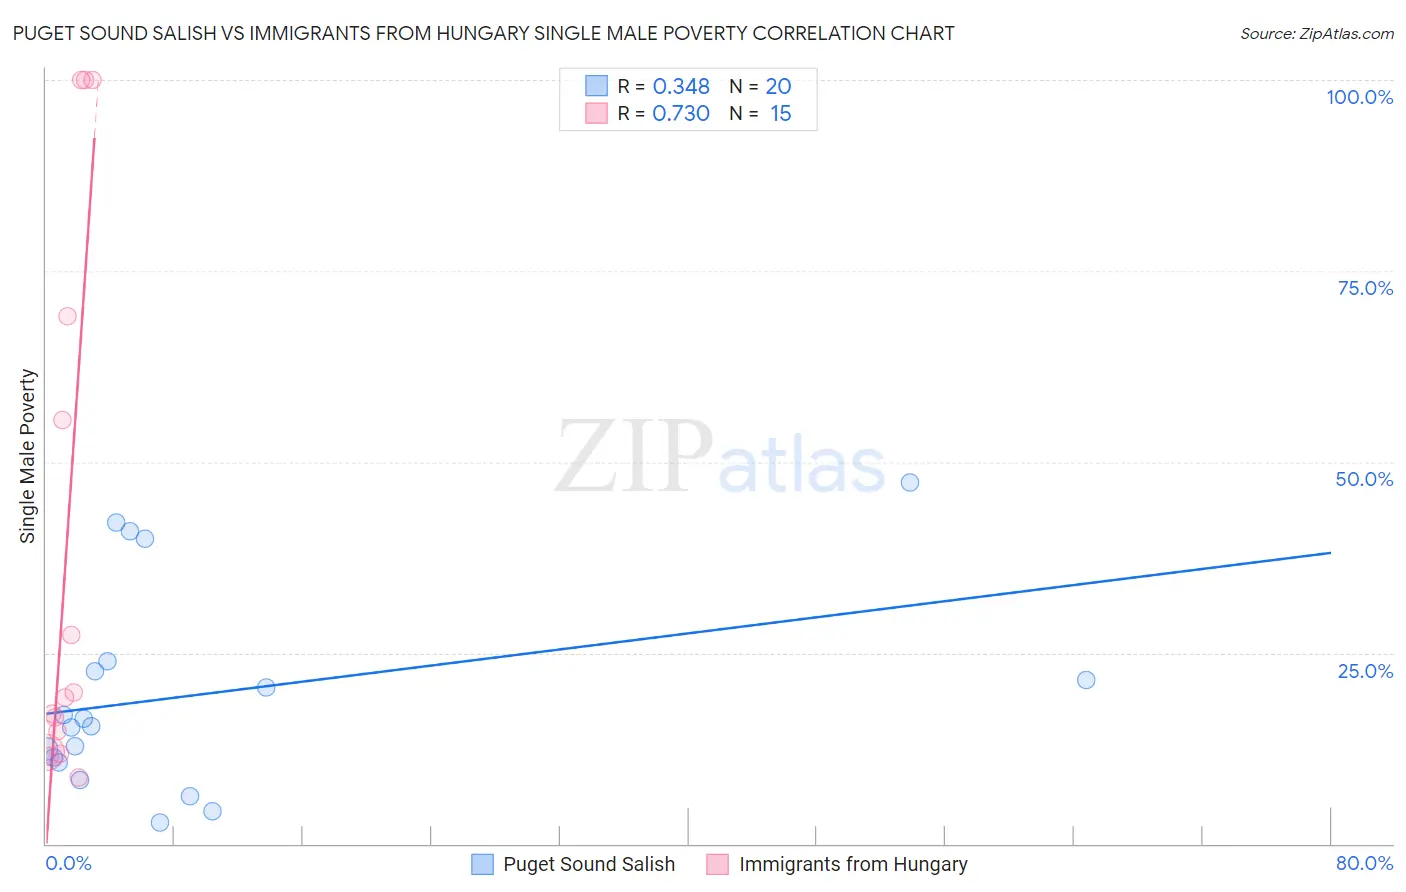
Puget Sound Salish vs Immigrants from Hungary Single Male Poverty Correlation Chart
The statistical analysis conducted on geographies consisting of 44,306,636 people shows a mild positive correlation between the proportion of Puget Sound Salish and poverty level among single males in the United States with a correlation coefficient (R) of 0.348 and weighted average of 12.8%. Similarly, the statistical analysis conducted on geographies consisting of 178,525,850 people shows a strong positive correlation between the proportion of Immigrants from Hungary and poverty level among single males in the United States with a correlation coefficient (R) of 0.730 and weighted average of 12.6%, a difference of 1.0%.
Single Male Poverty Correlation Summary
| Measurement | Puget Sound Salish | Immigrants from Hungary |
| Minimum | 2.8% | 8.7% |
| Maximum | 47.4% | 100.0% |
| Range | 44.6% | 91.3% |
| Mean | 19.6% | 38.9% |
| Median | 15.9% | 19.1% |
| Interquartile 25% (IQ1) | 10.9% | 11.9% |
| Interquartile 75% (IQ3) | 23.3% | 69.1% |
| Interquartile Range (IQR) | 12.4% | 57.2% |
| Standard Deviation (Sample) | 13.2% | 35.8% |
| Standard Deviation (Population) | 12.9% | 34.6% |
Demographics Similar to Puget Sound Salish and Immigrants from Hungary by Single Male Poverty
In terms of single male poverty, the demographic groups most similar to Puget Sound Salish are Guyanese (12.8%, a difference of 0.12%), Immigrants from Barbados (12.7%, a difference of 0.18%), Immigrants from Sudan (12.7%, a difference of 0.21%), Immigrants from Guyana (12.7%, a difference of 0.34%), and Immigrants from Cambodia (12.7%, a difference of 0.43%). Similarly, the demographic groups most similar to Immigrants from Hungary are Immigrants from Panama (12.6%, a difference of 0.010%), Australian (12.6%, a difference of 0.030%), Immigrants (12.7%, a difference of 0.12%), Immigrants from Scotland (12.7%, a difference of 0.19%), and Immigrants from Spain (12.7%, a difference of 0.21%).
| Demographics | Rating | Rank | Single Male Poverty |
| Immigrants | Panama | 72.1 /100 | #150 | Good 12.6% |
| Immigrants | Hungary | 71.9 /100 | #151 | Good 12.6% |
| Australians | 71.4 /100 | #152 | Good 12.6% |
| Immigrants | Immigrants | 70.1 /100 | #153 | Good 12.7% |
| Immigrants | Scotland | 68.9 /100 | #154 | Good 12.7% |
| Immigrants | Spain | 68.7 /100 | #155 | Good 12.7% |
| Vietnamese | 67.9 /100 | #156 | Good 12.7% |
| Latvians | 67.9 /100 | #157 | Good 12.7% |
| Immigrants | Middle Africa | 64.9 /100 | #158 | Good 12.7% |
| Immigrants | Liberia | 64.2 /100 | #159 | Good 12.7% |
| Greeks | 64.1 /100 | #160 | Good 12.7% |
| Immigrants | Africa | 63.4 /100 | #161 | Good 12.7% |
| Eastern Europeans | 63.3 /100 | #162 | Good 12.7% |
| Palestinians | 63.1 /100 | #163 | Good 12.7% |
| Immigrants | Nigeria | 62.8 /100 | #164 | Good 12.7% |
| Immigrants | Cambodia | 62.2 /100 | #165 | Good 12.7% |
| Immigrants | Guyana | 60.5 /100 | #166 | Good 12.7% |
| Immigrants | Sudan | 58.2 /100 | #167 | Average 12.7% |
| Immigrants | Barbados | 57.7 /100 | #168 | Average 12.7% |
| Puget Sound Salish | 54.3 /100 | #169 | Average 12.8% |
| Guyanese | 52.0 /100 | #170 | Average 12.8% |