Canadian vs Immigrants from Turkey Child Poverty Among Girls Under 16
COMPARE
Canadian
Immigrants from Turkey
Child Poverty Among Girls Under 16
Child Poverty Among Girls Under 16 Comparison
Canadians
Immigrants from Turkey
15.6%
CHILD POVERTY AMONG GIRLS UNDER 16
87.1/ 100
METRIC RATING
142nd/ 347
METRIC RANK
14.7%
CHILD POVERTY AMONG GIRLS UNDER 16
97.9/ 100
METRIC RATING
79th/ 347
METRIC RANK
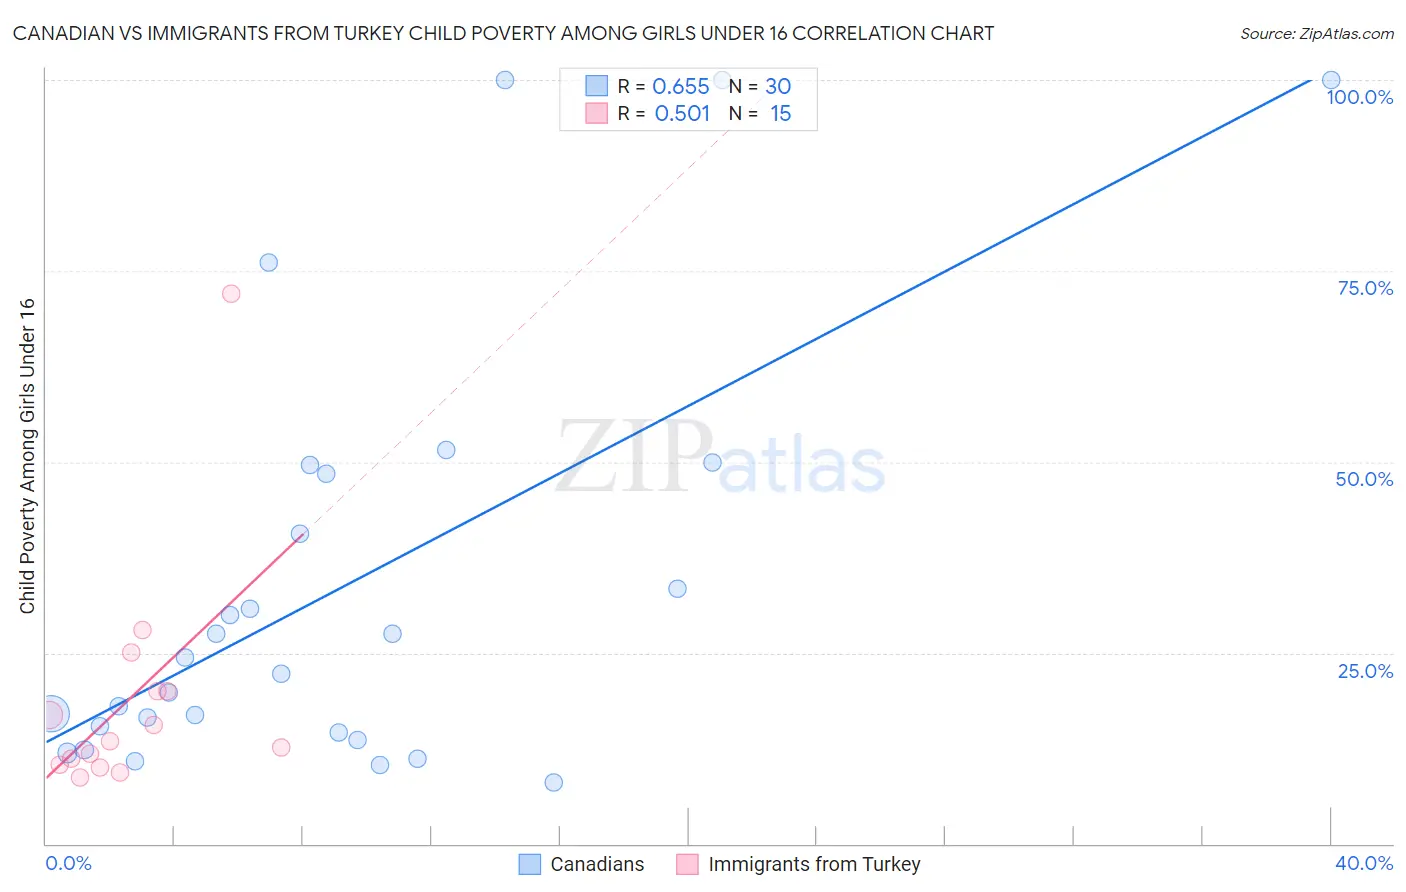
Canadian vs Immigrants from Turkey Child Poverty Among Girls Under 16 Correlation Chart
The statistical analysis conducted on geographies consisting of 426,709,261 people shows a significant positive correlation between the proportion of Canadians and poverty level among girls under the age of 16 in the United States with a correlation coefficient (R) of 0.655 and weighted average of 15.6%. Similarly, the statistical analysis conducted on geographies consisting of 219,871,426 people shows a substantial positive correlation between the proportion of Immigrants from Turkey and poverty level among girls under the age of 16 in the United States with a correlation coefficient (R) of 0.501 and weighted average of 14.7%, a difference of 6.2%.
Child Poverty Among Girls Under 16 Correlation Summary
| Measurement | Canadian | Immigrants from Turkey |
| Minimum | 8.1% | 8.6% |
| Maximum | 100.0% | 71.9% |
| Range | 91.9% | 63.3% |
| Mean | 33.6% | 19.0% |
| Median | 23.3% | 13.5% |
| Interquartile 25% (IQ1) | 14.5% | 10.3% |
| Interquartile 75% (IQ3) | 48.4% | 20.0% |
| Interquartile Range (IQR) | 33.9% | 9.7% |
| Standard Deviation (Sample) | 27.5% | 15.8% |
| Standard Deviation (Population) | 27.1% | 15.2% |
Similar Demographics by Child Poverty Among Girls Under 16
Demographics Similar to Canadians by Child Poverty Among Girls Under 16
In terms of child poverty among girls under 16, the demographic groups most similar to Canadians are Immigrants from Jordan (15.6%, a difference of 0.020%), New Zealander (15.6%, a difference of 0.030%), Immigrants from Peru (15.6%, a difference of 0.15%), Armenian (15.5%, a difference of 0.21%), and Israeli (15.6%, a difference of 0.24%).
| Demographics | Rating | Rank | Child Poverty Among Girls Under 16 |
| Czechoslovakians | 89.0 /100 | #135 | Excellent 15.5% |
| Native Hawaiians | 89.0 /100 | #136 | Excellent 15.5% |
| South Africans | 88.7 /100 | #137 | Excellent 15.5% |
| Immigrants | Vietnam | 88.2 /100 | #138 | Excellent 15.5% |
| Armenians | 87.9 /100 | #139 | Excellent 15.5% |
| New Zealanders | 87.2 /100 | #140 | Excellent 15.6% |
| Immigrants | Jordan | 87.2 /100 | #141 | Excellent 15.6% |
| Canadians | 87.1 /100 | #142 | Excellent 15.6% |
| Immigrants | Peru | 86.6 /100 | #143 | Excellent 15.6% |
| Israelis | 86.3 /100 | #144 | Excellent 15.6% |
| Welsh | 85.4 /100 | #145 | Excellent 15.6% |
| Samoans | 84.2 /100 | #146 | Excellent 15.7% |
| Slavs | 83.1 /100 | #147 | Excellent 15.7% |
| Icelanders | 82.4 /100 | #148 | Excellent 15.7% |
| Immigrants | Hungary | 80.9 /100 | #149 | Excellent 15.8% |
Demographics Similar to Immigrants from Turkey by Child Poverty Among Girls Under 16
In terms of child poverty among girls under 16, the demographic groups most similar to Immigrants from Turkey are Egyptian (14.7%, a difference of 0.0%), Tlingit-Haida (14.7%, a difference of 0.020%), Argentinean (14.7%, a difference of 0.020%), Immigrants from Russia (14.7%, a difference of 0.030%), and Immigrants from Eastern Europe (14.6%, a difference of 0.18%).
| Demographics | Rating | Rank | Child Poverty Among Girls Under 16 |
| Immigrants | Netherlands | 98.1 /100 | #72 | Exceptional 14.6% |
| Immigrants | Austria | 98.0 /100 | #73 | Exceptional 14.6% |
| Taiwanese | 98.0 /100 | #74 | Exceptional 14.6% |
| Immigrants | Eastern Europe | 98.0 /100 | #75 | Exceptional 14.6% |
| Immigrants | Russia | 97.9 /100 | #76 | Exceptional 14.7% |
| Tlingit-Haida | 97.9 /100 | #77 | Exceptional 14.7% |
| Argentineans | 97.9 /100 | #78 | Exceptional 14.7% |
| Immigrants | Turkey | 97.9 /100 | #79 | Exceptional 14.7% |
| Egyptians | 97.9 /100 | #80 | Exceptional 14.7% |
| Ukrainians | 97.7 /100 | #81 | Exceptional 14.7% |
| Macedonians | 97.6 /100 | #82 | Exceptional 14.7% |
| Immigrants | Italy | 97.4 /100 | #83 | Exceptional 14.8% |
| Soviet Union | 97.3 /100 | #84 | Exceptional 14.8% |
| Swiss | 97.2 /100 | #85 | Exceptional 14.8% |
| Australians | 97.2 /100 | #86 | Exceptional 14.8% |