Immigrants from Belize vs Cree Single Male Poverty
COMPARE
Immigrants from Belize
Cree
Single Male Poverty
Single Male Poverty Comparison
Immigrants from Belize
Cree
13.7%
SINGLE MALE POVERTY
0.4/ 100
METRIC RATING
256th/ 347
METRIC RANK
15.1%
SINGLE MALE POVERTY
0.0/ 100
METRIC RATING
300th/ 347
METRIC RANK
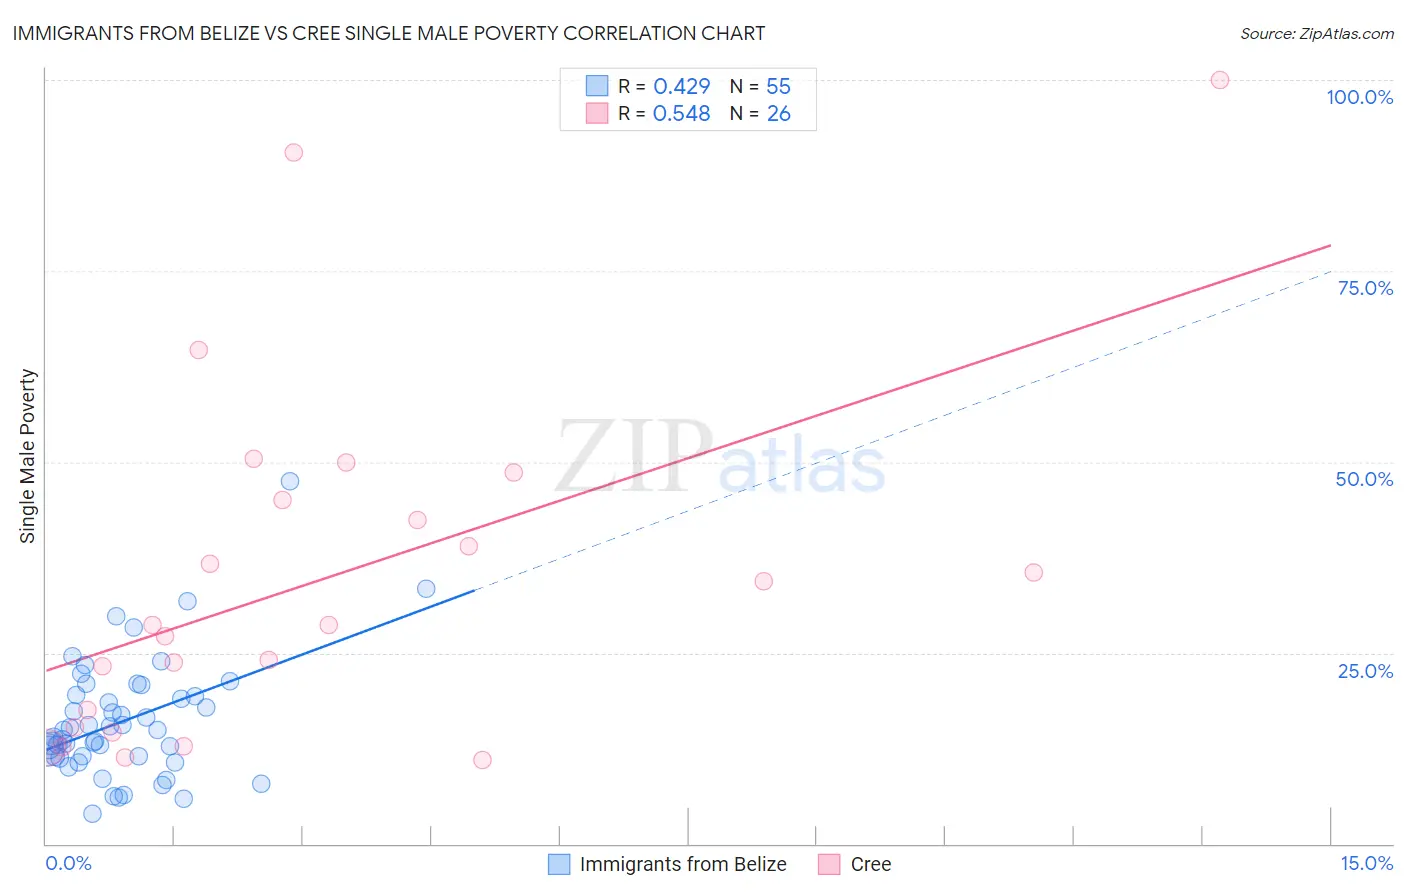
Immigrants from Belize vs Cree Single Male Poverty Correlation Chart
The statistical analysis conducted on geographies consisting of 125,025,572 people shows a moderate positive correlation between the proportion of Immigrants from Belize and poverty level among single males in the United States with a correlation coefficient (R) of 0.429 and weighted average of 13.7%. Similarly, the statistical analysis conducted on geographies consisting of 73,575,391 people shows a substantial positive correlation between the proportion of Cree and poverty level among single males in the United States with a correlation coefficient (R) of 0.548 and weighted average of 15.1%, a difference of 10.0%.
Single Male Poverty Correlation Summary
| Measurement | Immigrants from Belize | Cree |
| Minimum | 4.0% | 11.0% |
| Maximum | 47.5% | 100.0% |
| Range | 43.5% | 89.0% |
| Mean | 16.1% | 34.6% |
| Median | 14.8% | 28.6% |
| Interquartile 25% (IQ1) | 11.5% | 15.2% |
| Interquartile 75% (IQ3) | 19.5% | 45.0% |
| Interquartile Range (IQR) | 8.0% | 29.8% |
| Standard Deviation (Sample) | 7.8% | 23.1% |
| Standard Deviation (Population) | 7.8% | 22.6% |
Similar Demographics by Single Male Poverty
Demographics Similar to Immigrants from Belize by Single Male Poverty
In terms of single male poverty, the demographic groups most similar to Immigrants from Belize are Spaniard (13.7%, a difference of 0.10%), Immigrants from Central America (13.8%, a difference of 0.18%), Subsaharan African (13.7%, a difference of 0.21%), Immigrants from Guatemala (13.8%, a difference of 0.25%), and Guatemalan (13.8%, a difference of 0.29%).
| Demographics | Rating | Rank | Single Male Poverty |
| Spanish | 1.0 /100 | #249 | Tragic 13.6% |
| Immigrants | Somalia | 1.0 /100 | #250 | Tragic 13.6% |
| Immigrants | Zaire | 0.9 /100 | #251 | Tragic 13.6% |
| Finns | 0.9 /100 | #252 | Tragic 13.6% |
| German Russians | 0.8 /100 | #253 | Tragic 13.6% |
| Sub-Saharan Africans | 0.5 /100 | #254 | Tragic 13.7% |
| Spaniards | 0.4 /100 | #255 | Tragic 13.7% |
| Immigrants | Belize | 0.4 /100 | #256 | Tragic 13.7% |
| Immigrants | Central America | 0.3 /100 | #257 | Tragic 13.8% |
| Immigrants | Guatemala | 0.3 /100 | #258 | Tragic 13.8% |
| Guatemalans | 0.3 /100 | #259 | Tragic 13.8% |
| Swiss | 0.3 /100 | #260 | Tragic 13.8% |
| Hungarians | 0.3 /100 | #261 | Tragic 13.8% |
| Fijians | 0.3 /100 | #262 | Tragic 13.8% |
| Cape Verdeans | 0.2 /100 | #263 | Tragic 13.8% |
Demographics Similar to Cree by Single Male Poverty
In terms of single male poverty, the demographic groups most similar to Cree are Delaware (15.0%, a difference of 0.45%), Dominican (15.2%, a difference of 0.82%), French American Indian (15.0%, a difference of 0.84%), Alsatian (15.2%, a difference of 0.98%), and Aleut (15.4%, a difference of 2.0%).
| Demographics | Rating | Rank | Single Male Poverty |
| French Canadians | 0.0 /100 | #293 | Tragic 14.6% |
| Ottawa | 0.0 /100 | #294 | Tragic 14.6% |
| Scotch-Irish | 0.0 /100 | #295 | Tragic 14.7% |
| Africans | 0.0 /100 | #296 | Tragic 14.7% |
| Immigrants | Dominican Republic | 0.0 /100 | #297 | Tragic 14.8% |
| French American Indians | 0.0 /100 | #298 | Tragic 15.0% |
| Delaware | 0.0 /100 | #299 | Tragic 15.0% |
| Cree | 0.0 /100 | #300 | Tragic 15.1% |
| Dominicans | 0.0 /100 | #301 | Tragic 15.2% |
| Alsatians | 0.0 /100 | #302 | Tragic 15.2% |
| Aleuts | 0.0 /100 | #303 | Tragic 15.4% |
| Alaska Natives | 0.0 /100 | #304 | Tragic 15.4% |
| Blackfeet | 0.0 /100 | #305 | Tragic 15.5% |
| Pennsylvania Germans | 0.0 /100 | #306 | Tragic 15.6% |
| Ute | 0.0 /100 | #307 | Tragic 15.7% |