South African vs Cree Single Male Poverty
COMPARE
South African
Cree
Single Male Poverty
Single Male Poverty Comparison
South Africans
Cree
12.8%
SINGLE MALE POVERTY
51.5/ 100
METRIC RATING
171st/ 347
METRIC RANK
15.1%
SINGLE MALE POVERTY
0.0/ 100
METRIC RATING
300th/ 347
METRIC RANK
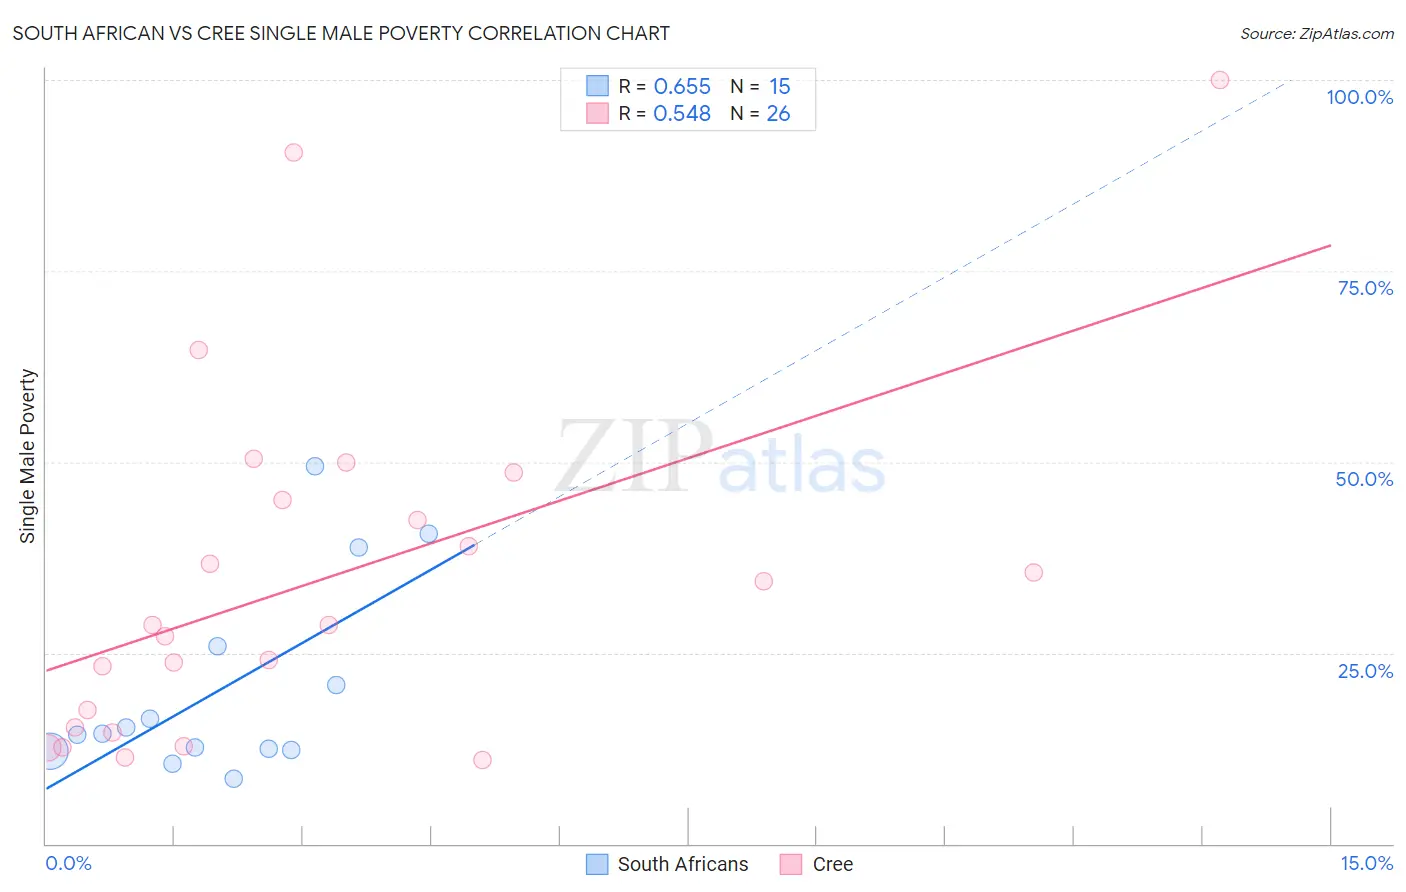
South African vs Cree Single Male Poverty Correlation Chart
The statistical analysis conducted on geographies consisting of 166,469,004 people shows a significant positive correlation between the proportion of South Africans and poverty level among single males in the United States with a correlation coefficient (R) of 0.655 and weighted average of 12.8%. Similarly, the statistical analysis conducted on geographies consisting of 73,575,391 people shows a substantial positive correlation between the proportion of Cree and poverty level among single males in the United States with a correlation coefficient (R) of 0.548 and weighted average of 15.1%, a difference of 18.0%.
Single Male Poverty Correlation Summary
| Measurement | South African | Cree |
| Minimum | 8.5% | 11.0% |
| Maximum | 49.4% | 100.0% |
| Range | 41.0% | 89.0% |
| Mean | 20.3% | 34.6% |
| Median | 14.3% | 28.6% |
| Interquartile 25% (IQ1) | 12.3% | 15.2% |
| Interquartile 75% (IQ3) | 25.9% | 45.0% |
| Interquartile Range (IQR) | 13.6% | 29.8% |
| Standard Deviation (Sample) | 12.6% | 23.1% |
| Standard Deviation (Population) | 12.2% | 22.6% |
Similar Demographics by Single Male Poverty
Demographics Similar to South Africans by Single Male Poverty
In terms of single male poverty, the demographic groups most similar to South Africans are Danish (12.8%, a difference of 0.0%), Guyanese (12.8%, a difference of 0.030%), Immigrants from St. Vincent and the Grenadines (12.8%, a difference of 0.030%), Costa Rican (12.8%, a difference of 0.080%), and Croatian (12.8%, a difference of 0.14%).
| Demographics | Rating | Rank | Single Male Poverty |
| Immigrants | Nigeria | 62.8 /100 | #164 | Good 12.7% |
| Immigrants | Cambodia | 62.2 /100 | #165 | Good 12.7% |
| Immigrants | Guyana | 60.5 /100 | #166 | Good 12.7% |
| Immigrants | Sudan | 58.2 /100 | #167 | Average 12.7% |
| Immigrants | Barbados | 57.7 /100 | #168 | Average 12.7% |
| Puget Sound Salish | 54.3 /100 | #169 | Average 12.8% |
| Guyanese | 52.0 /100 | #170 | Average 12.8% |
| South Africans | 51.5 /100 | #171 | Average 12.8% |
| Danes | 51.4 /100 | #172 | Average 12.8% |
| Immigrants | St. Vincent and the Grenadines | 50.9 /100 | #173 | Average 12.8% |
| Costa Ricans | 50.0 /100 | #174 | Average 12.8% |
| Croatians | 48.9 /100 | #175 | Average 12.8% |
| Syrians | 48.4 /100 | #176 | Average 12.8% |
| Immigrants | Canada | 44.8 /100 | #177 | Average 12.8% |
| Immigrants | Switzerland | 43.1 /100 | #178 | Average 12.8% |
Demographics Similar to Cree by Single Male Poverty
In terms of single male poverty, the demographic groups most similar to Cree are Delaware (15.0%, a difference of 0.45%), Dominican (15.2%, a difference of 0.82%), French American Indian (15.0%, a difference of 0.84%), Alsatian (15.2%, a difference of 0.98%), and Aleut (15.4%, a difference of 2.0%).
| Demographics | Rating | Rank | Single Male Poverty |
| French Canadians | 0.0 /100 | #293 | Tragic 14.6% |
| Ottawa | 0.0 /100 | #294 | Tragic 14.6% |
| Scotch-Irish | 0.0 /100 | #295 | Tragic 14.7% |
| Africans | 0.0 /100 | #296 | Tragic 14.7% |
| Immigrants | Dominican Republic | 0.0 /100 | #297 | Tragic 14.8% |
| French American Indians | 0.0 /100 | #298 | Tragic 15.0% |
| Delaware | 0.0 /100 | #299 | Tragic 15.0% |
| Cree | 0.0 /100 | #300 | Tragic 15.1% |
| Dominicans | 0.0 /100 | #301 | Tragic 15.2% |
| Alsatians | 0.0 /100 | #302 | Tragic 15.2% |
| Aleuts | 0.0 /100 | #303 | Tragic 15.4% |
| Alaska Natives | 0.0 /100 | #304 | Tragic 15.4% |
| Blackfeet | 0.0 /100 | #305 | Tragic 15.5% |
| Pennsylvania Germans | 0.0 /100 | #306 | Tragic 15.6% |
| Ute | 0.0 /100 | #307 | Tragic 15.7% |