Cambodian vs Ute Single Father Poverty
COMPARE
Cambodian
Ute
Single Father Poverty
Single Father Poverty Comparison
Cambodians
Ute
16.4%
SINGLE FATHER POVERTY
34.6/ 100
METRIC RATING
184th/ 347
METRIC RANK
18.5%
SINGLE FATHER POVERTY
0.0/ 100
METRIC RATING
304th/ 347
METRIC RANK
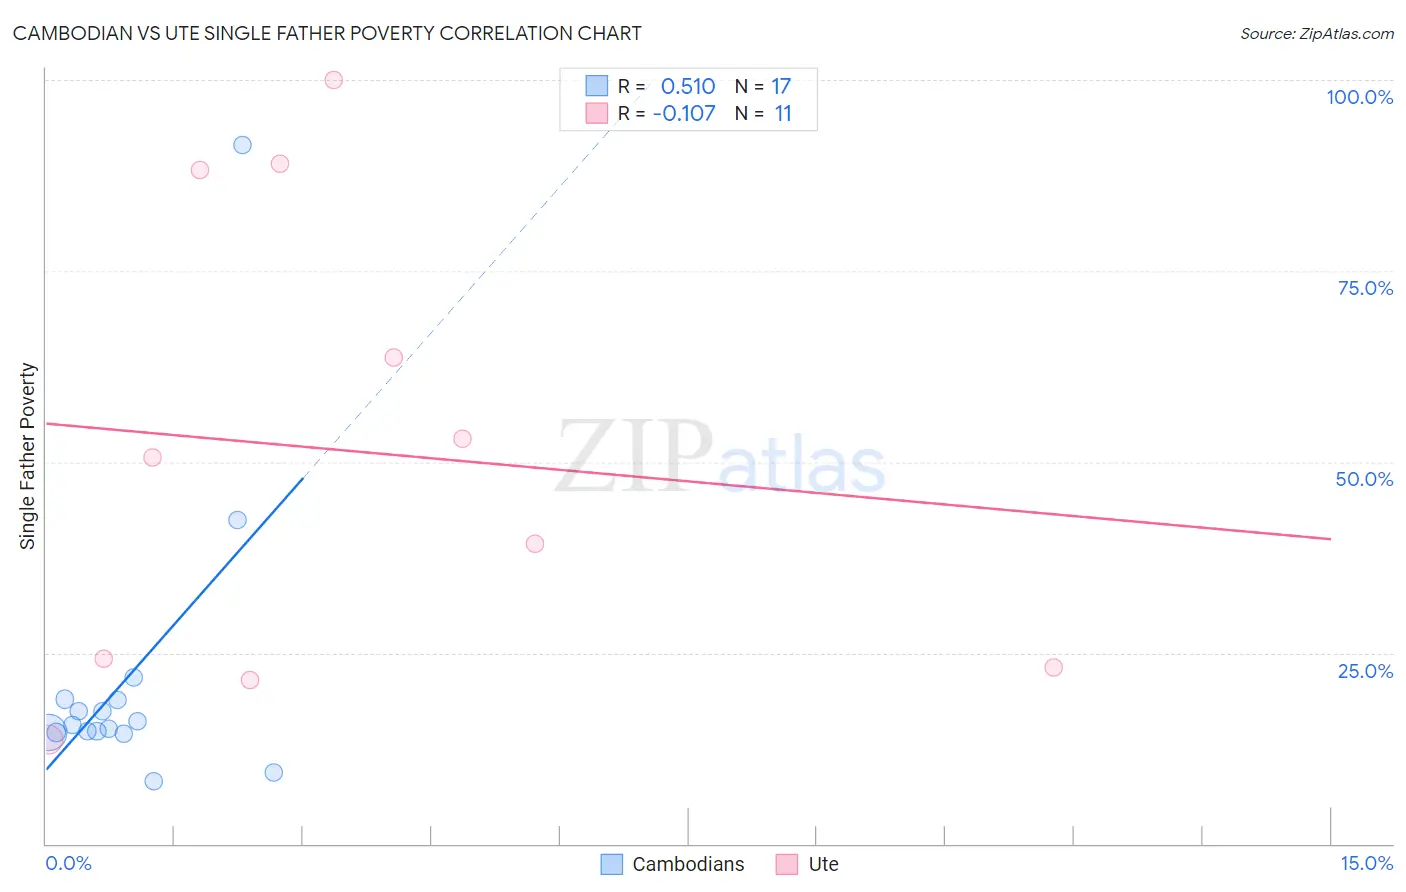
Cambodian vs Ute Single Father Poverty Correlation Chart
The statistical analysis conducted on geographies consisting of 91,317,365 people shows a substantial positive correlation between the proportion of Cambodians and poverty level among single fathers in the United States with a correlation coefficient (R) of 0.510 and weighted average of 16.4%. Similarly, the statistical analysis conducted on geographies consisting of 52,132,597 people shows a poor negative correlation between the proportion of Ute and poverty level among single fathers in the United States with a correlation coefficient (R) of -0.107 and weighted average of 18.5%, a difference of 12.8%.
Single Father Poverty Correlation Summary
| Measurement | Cambodian | Ute |
| Minimum | 8.1% | 13.7% |
| Maximum | 91.5% | 100.0% |
| Range | 83.4% | 86.3% |
| Mean | 21.5% | 51.5% |
| Median | 15.6% | 50.6% |
| Interquartile 25% (IQ1) | 14.5% | 23.1% |
| Interquartile 75% (IQ3) | 18.9% | 88.2% |
| Interquartile Range (IQR) | 4.4% | 65.1% |
| Standard Deviation (Sample) | 19.5% | 30.5% |
| Standard Deviation (Population) | 18.9% | 29.1% |
Similar Demographics by Single Father Poverty
Demographics Similar to Cambodians by Single Father Poverty
In terms of single father poverty, the demographic groups most similar to Cambodians are Aleut (16.4%, a difference of 0.030%), Immigrants from Italy (16.4%, a difference of 0.050%), Panamanian (16.4%, a difference of 0.050%), Immigrants from Western Africa (16.4%, a difference of 0.060%), and Immigrants from Latin America (16.4%, a difference of 0.12%).
| Demographics | Rating | Rank | Single Father Poverty |
| Immigrants | South Africa | 44.2 /100 | #177 | Average 16.3% |
| Immigrants | Cuba | 41.6 /100 | #178 | Average 16.4% |
| Serbians | 40.9 /100 | #179 | Average 16.4% |
| Immigrants | Latin America | 37.2 /100 | #180 | Fair 16.4% |
| Immigrants | Western Africa | 36.0 /100 | #181 | Fair 16.4% |
| Immigrants | Italy | 35.7 /100 | #182 | Fair 16.4% |
| Aleuts | 35.3 /100 | #183 | Fair 16.4% |
| Cambodians | 34.6 /100 | #184 | Fair 16.4% |
| Panamanians | 33.6 /100 | #185 | Fair 16.4% |
| Immigrants | Venezuela | 31.0 /100 | #186 | Fair 16.4% |
| Ukrainians | 30.4 /100 | #187 | Fair 16.4% |
| Russians | 30.1 /100 | #188 | Fair 16.4% |
| Latvians | 28.9 /100 | #189 | Fair 16.5% |
| Immigrants | Burma/Myanmar | 28.0 /100 | #190 | Fair 16.5% |
| Immigrants | Guyana | 27.1 /100 | #191 | Fair 16.5% |
Demographics Similar to Ute by Single Father Poverty
In terms of single father poverty, the demographic groups most similar to Ute are Blackfeet (18.5%, a difference of 0.050%), Celtic (18.5%, a difference of 0.14%), Comanche (18.5%, a difference of 0.18%), Scotch-Irish (18.6%, a difference of 0.27%), and Hungarian (18.5%, a difference of 0.29%).
| Demographics | Rating | Rank | Single Father Poverty |
| French | 0.0 /100 | #297 | Tragic 18.2% |
| Africans | 0.0 /100 | #298 | Tragic 18.3% |
| Whites/Caucasians | 0.0 /100 | #299 | Tragic 18.4% |
| Immigrants | Dominican Republic | 0.0 /100 | #300 | Tragic 18.4% |
| Hungarians | 0.0 /100 | #301 | Tragic 18.5% |
| Comanche | 0.0 /100 | #302 | Tragic 18.5% |
| Celtics | 0.0 /100 | #303 | Tragic 18.5% |
| Ute | 0.0 /100 | #304 | Tragic 18.5% |
| Blackfeet | 0.0 /100 | #305 | Tragic 18.5% |
| Scotch-Irish | 0.0 /100 | #306 | Tragic 18.6% |
| French Canadians | 0.0 /100 | #307 | Tragic 18.6% |
| Ottawa | 0.0 /100 | #308 | Tragic 18.6% |
| Immigrants | Micronesia | 0.0 /100 | #309 | Tragic 18.6% |
| Chippewa | 0.0 /100 | #310 | Tragic 18.8% |
| Immigrants | Nonimmigrants | 0.0 /100 | #311 | Tragic 18.8% |