Immigrants from Vietnam vs Ute Single Father Poverty
COMPARE
Immigrants from Vietnam
Ute
Single Father Poverty
Single Father Poverty Comparison
Immigrants from Vietnam
Ute
14.1%
SINGLE FATHER POVERTY
100.0/ 100
METRIC RATING
14th/ 347
METRIC RANK
18.5%
SINGLE FATHER POVERTY
0.0/ 100
METRIC RATING
304th/ 347
METRIC RANK
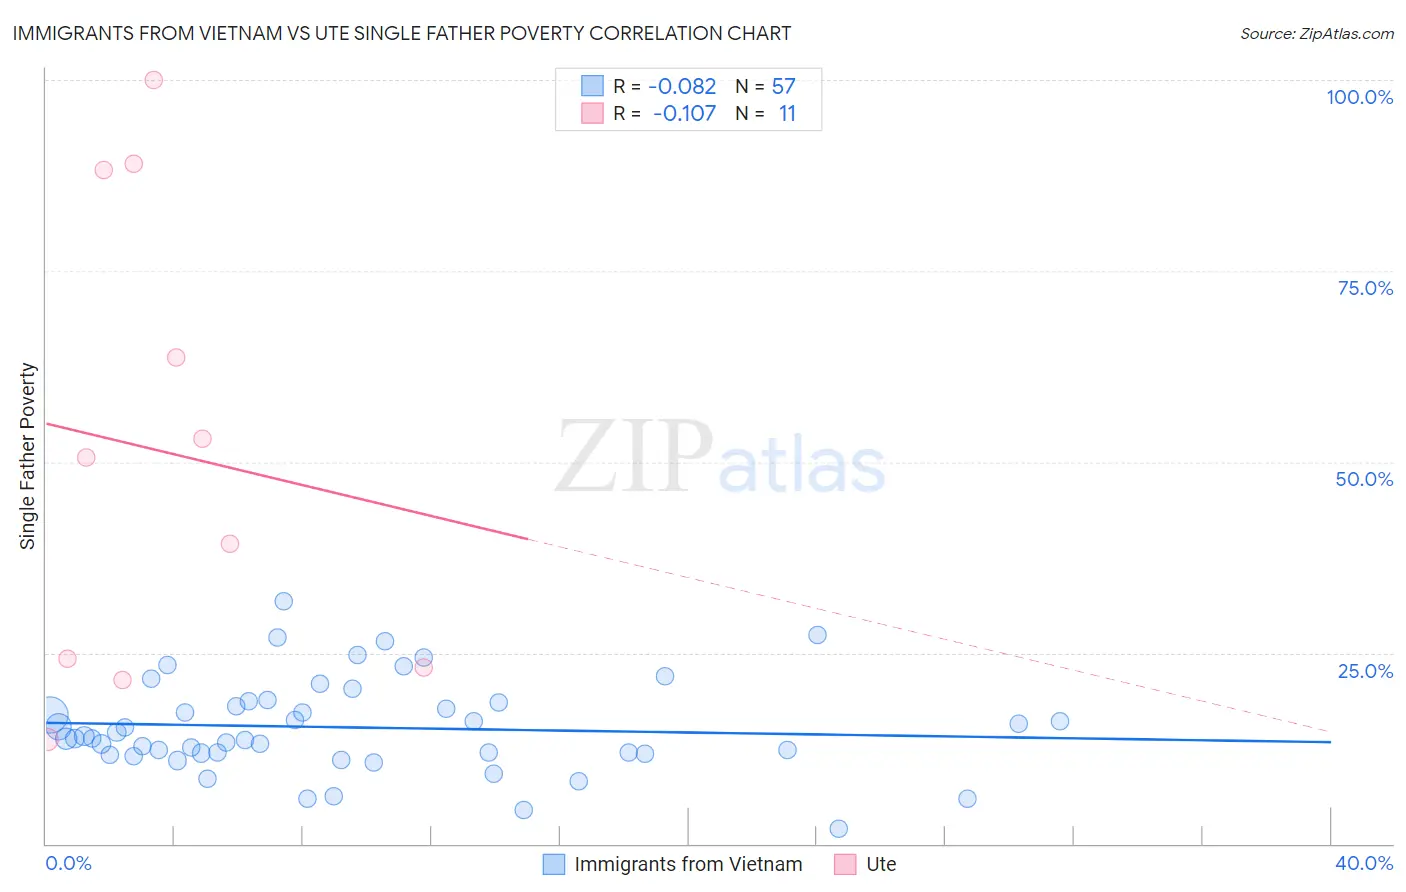
Immigrants from Vietnam vs Ute Single Father Poverty Correlation Chart
The statistical analysis conducted on geographies consisting of 320,936,660 people shows a slight negative correlation between the proportion of Immigrants from Vietnam and poverty level among single fathers in the United States with a correlation coefficient (R) of -0.082 and weighted average of 14.1%. Similarly, the statistical analysis conducted on geographies consisting of 52,132,597 people shows a poor negative correlation between the proportion of Ute and poverty level among single fathers in the United States with a correlation coefficient (R) of -0.107 and weighted average of 18.5%, a difference of 30.8%.
Single Father Poverty Correlation Summary
| Measurement | Immigrants from Vietnam | Ute |
| Minimum | 2.0% | 13.7% |
| Maximum | 31.8% | 100.0% |
| Range | 29.8% | 86.3% |
| Mean | 15.2% | 51.5% |
| Median | 13.8% | 50.6% |
| Interquartile 25% (IQ1) | 11.8% | 23.1% |
| Interquartile 75% (IQ3) | 18.5% | 88.2% |
| Interquartile Range (IQR) | 6.7% | 65.1% |
| Standard Deviation (Sample) | 6.1% | 30.5% |
| Standard Deviation (Population) | 6.0% | 29.1% |
Similar Demographics by Single Father Poverty
Demographics Similar to Immigrants from Vietnam by Single Father Poverty
In terms of single father poverty, the demographic groups most similar to Immigrants from Vietnam are Sri Lankan (14.2%, a difference of 0.050%), Immigrants from Iran (14.2%, a difference of 0.26%), Immigrants from Philippines (14.0%, a difference of 0.70%), Immigrants from Hong Kong (14.2%, a difference of 0.71%), and Soviet Union (14.3%, a difference of 0.74%).
| Demographics | Rating | Rank | Single Father Poverty |
| Immigrants | Taiwan | 100.0 /100 | #7 | Exceptional 13.7% |
| Samoans | 100.0 /100 | #8 | Exceptional 13.8% |
| Afghans | 100.0 /100 | #9 | Exceptional 14.0% |
| Koreans | 100.0 /100 | #10 | Exceptional 14.0% |
| Filipinos | 100.0 /100 | #11 | Exceptional 14.0% |
| Immigrants | India | 100.0 /100 | #12 | Exceptional 14.0% |
| Immigrants | Philippines | 100.0 /100 | #13 | Exceptional 14.0% |
| Immigrants | Vietnam | 100.0 /100 | #14 | Exceptional 14.1% |
| Sri Lankans | 100.0 /100 | #15 | Exceptional 14.2% |
| Immigrants | Iran | 100.0 /100 | #16 | Exceptional 14.2% |
| Immigrants | Hong Kong | 100.0 /100 | #17 | Exceptional 14.2% |
| Soviet Union | 100.0 /100 | #18 | Exceptional 14.3% |
| Immigrants | Iraq | 100.0 /100 | #19 | Exceptional 14.3% |
| Immigrants | Singapore | 100.0 /100 | #20 | Exceptional 14.3% |
| Immigrants | Afghanistan | 100.0 /100 | #21 | Exceptional 14.3% |
Demographics Similar to Ute by Single Father Poverty
In terms of single father poverty, the demographic groups most similar to Ute are Blackfeet (18.5%, a difference of 0.050%), Celtic (18.5%, a difference of 0.14%), Comanche (18.5%, a difference of 0.18%), Scotch-Irish (18.6%, a difference of 0.27%), and Hungarian (18.5%, a difference of 0.29%).
| Demographics | Rating | Rank | Single Father Poverty |
| French | 0.0 /100 | #297 | Tragic 18.2% |
| Africans | 0.0 /100 | #298 | Tragic 18.3% |
| Whites/Caucasians | 0.0 /100 | #299 | Tragic 18.4% |
| Immigrants | Dominican Republic | 0.0 /100 | #300 | Tragic 18.4% |
| Hungarians | 0.0 /100 | #301 | Tragic 18.5% |
| Comanche | 0.0 /100 | #302 | Tragic 18.5% |
| Celtics | 0.0 /100 | #303 | Tragic 18.5% |
| Ute | 0.0 /100 | #304 | Tragic 18.5% |
| Blackfeet | 0.0 /100 | #305 | Tragic 18.5% |
| Scotch-Irish | 0.0 /100 | #306 | Tragic 18.6% |
| French Canadians | 0.0 /100 | #307 | Tragic 18.6% |
| Ottawa | 0.0 /100 | #308 | Tragic 18.6% |
| Immigrants | Micronesia | 0.0 /100 | #309 | Tragic 18.6% |
| Chippewa | 0.0 /100 | #310 | Tragic 18.8% |
| Immigrants | Nonimmigrants | 0.0 /100 | #311 | Tragic 18.8% |