Immigrants from North Macedonia vs Ute Single Father Poverty
COMPARE
Immigrants from North Macedonia
Ute
Single Father Poverty
Single Father Poverty Comparison
Immigrants from North Macedonia
Ute
17.9%
SINGLE FATHER POVERTY
0.0/ 100
METRIC RATING
286th/ 347
METRIC RANK
18.5%
SINGLE FATHER POVERTY
0.0/ 100
METRIC RATING
304th/ 347
METRIC RANK
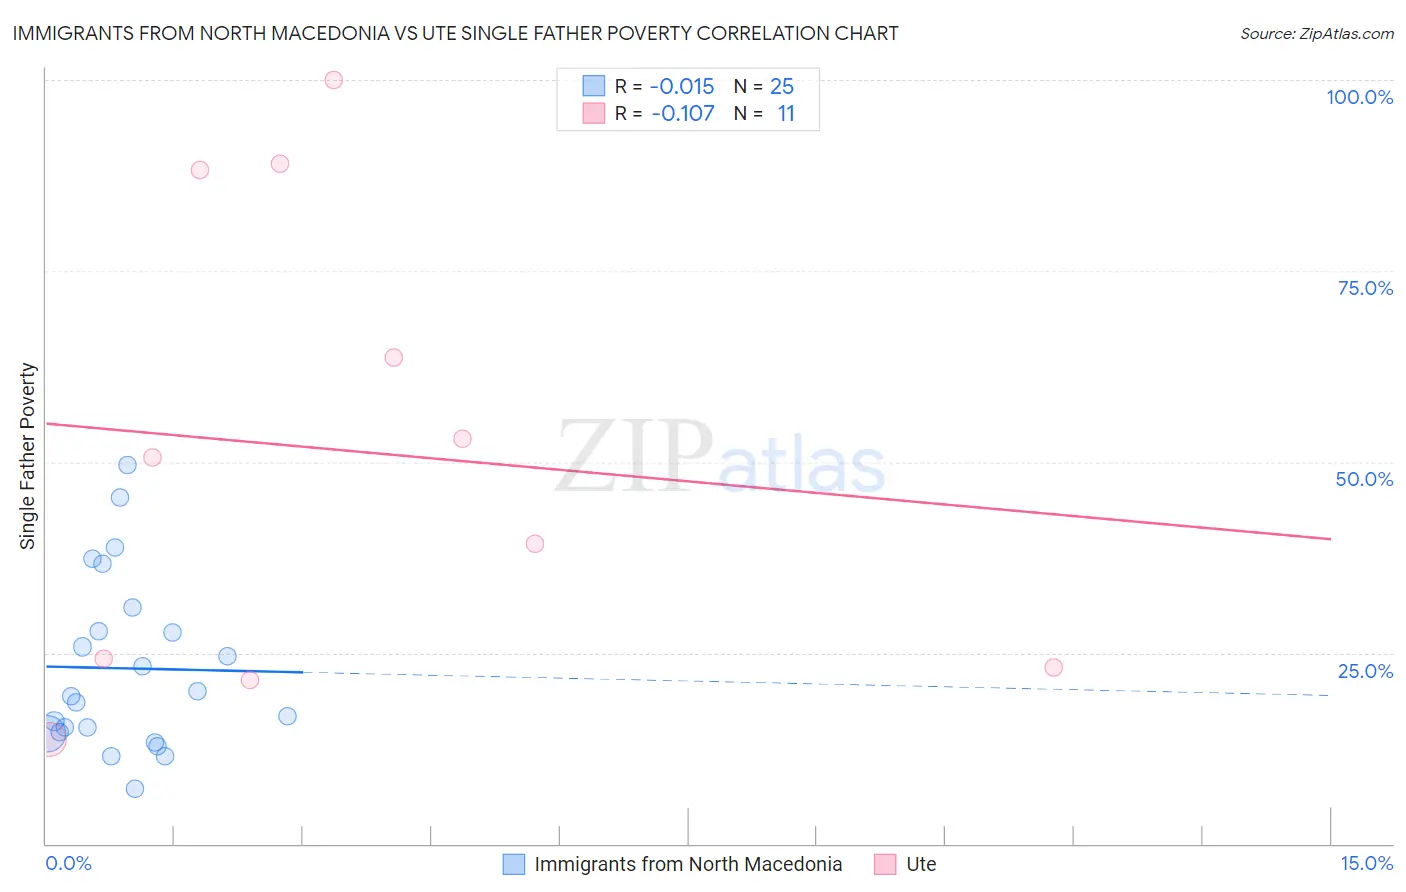
Immigrants from North Macedonia vs Ute Single Father Poverty Correlation Chart
The statistical analysis conducted on geographies consisting of 65,204,585 people shows no correlation between the proportion of Immigrants from North Macedonia and poverty level among single fathers in the United States with a correlation coefficient (R) of -0.015 and weighted average of 17.9%. Similarly, the statistical analysis conducted on geographies consisting of 52,132,597 people shows a poor negative correlation between the proportion of Ute and poverty level among single fathers in the United States with a correlation coefficient (R) of -0.107 and weighted average of 18.5%, a difference of 3.3%.
Single Father Poverty Correlation Summary
| Measurement | Immigrants from North Macedonia | Ute |
| Minimum | 7.1% | 13.7% |
| Maximum | 49.6% | 100.0% |
| Range | 42.5% | 86.3% |
| Mean | 23.0% | 51.5% |
| Median | 19.3% | 50.6% |
| Interquartile 25% (IQ1) | 14.5% | 23.1% |
| Interquartile 75% (IQ3) | 29.4% | 88.2% |
| Interquartile Range (IQR) | 14.9% | 65.1% |
| Standard Deviation (Sample) | 11.3% | 30.5% |
| Standard Deviation (Population) | 11.1% | 29.1% |
Demographics Similar to Immigrants from North Macedonia and Ute by Single Father Poverty
In terms of single father poverty, the demographic groups most similar to Immigrants from North Macedonia are Immigrants from Lebanon (17.9%, a difference of 0.18%), Carpatho Rusyn (18.0%, a difference of 0.22%), Bahamian (18.0%, a difference of 0.25%), Irish (18.0%, a difference of 0.69%), and West Indian (18.0%, a difference of 0.71%). Similarly, the demographic groups most similar to Ute are Blackfeet (18.5%, a difference of 0.050%), Celtic (18.5%, a difference of 0.14%), Comanche (18.5%, a difference of 0.18%), Hungarian (18.5%, a difference of 0.29%), and Immigrants from Dominican Republic (18.4%, a difference of 0.51%).
| Demographics | Rating | Rank | Single Father Poverty |
| Immigrants | Lebanon | 0.0 /100 | #285 | Tragic 17.9% |
| Immigrants | North Macedonia | 0.0 /100 | #286 | Tragic 17.9% |
| Carpatho Rusyns | 0.0 /100 | #287 | Tragic 18.0% |
| Bahamians | 0.0 /100 | #288 | Tragic 18.0% |
| Irish | 0.0 /100 | #289 | Tragic 18.0% |
| West Indians | 0.0 /100 | #290 | Tragic 18.0% |
| Alaskan Athabascans | 0.0 /100 | #291 | Tragic 18.1% |
| Immigrants | Bahamas | 0.0 /100 | #292 | Tragic 18.1% |
| Alaska Natives | 0.0 /100 | #293 | Tragic 18.1% |
| U.S. Virgin Islanders | 0.0 /100 | #294 | Tragic 18.1% |
| Yakama | 0.0 /100 | #295 | Tragic 18.1% |
| Seminole | 0.0 /100 | #296 | Tragic 18.1% |
| French | 0.0 /100 | #297 | Tragic 18.2% |
| Africans | 0.0 /100 | #298 | Tragic 18.3% |
| Whites/Caucasians | 0.0 /100 | #299 | Tragic 18.4% |
| Immigrants | Dominican Republic | 0.0 /100 | #300 | Tragic 18.4% |
| Hungarians | 0.0 /100 | #301 | Tragic 18.5% |
| Comanche | 0.0 /100 | #302 | Tragic 18.5% |
| Celtics | 0.0 /100 | #303 | Tragic 18.5% |
| Ute | 0.0 /100 | #304 | Tragic 18.5% |
| Blackfeet | 0.0 /100 | #305 | Tragic 18.5% |