Chilean vs Ute Single Father Poverty
COMPARE
Chilean
Ute
Single Father Poverty
Single Father Poverty Comparison
Chileans
Ute
15.7%
SINGLE FATHER POVERTY
96.4/ 100
METRIC RATING
102nd/ 347
METRIC RANK
18.5%
SINGLE FATHER POVERTY
0.0/ 100
METRIC RATING
304th/ 347
METRIC RANK
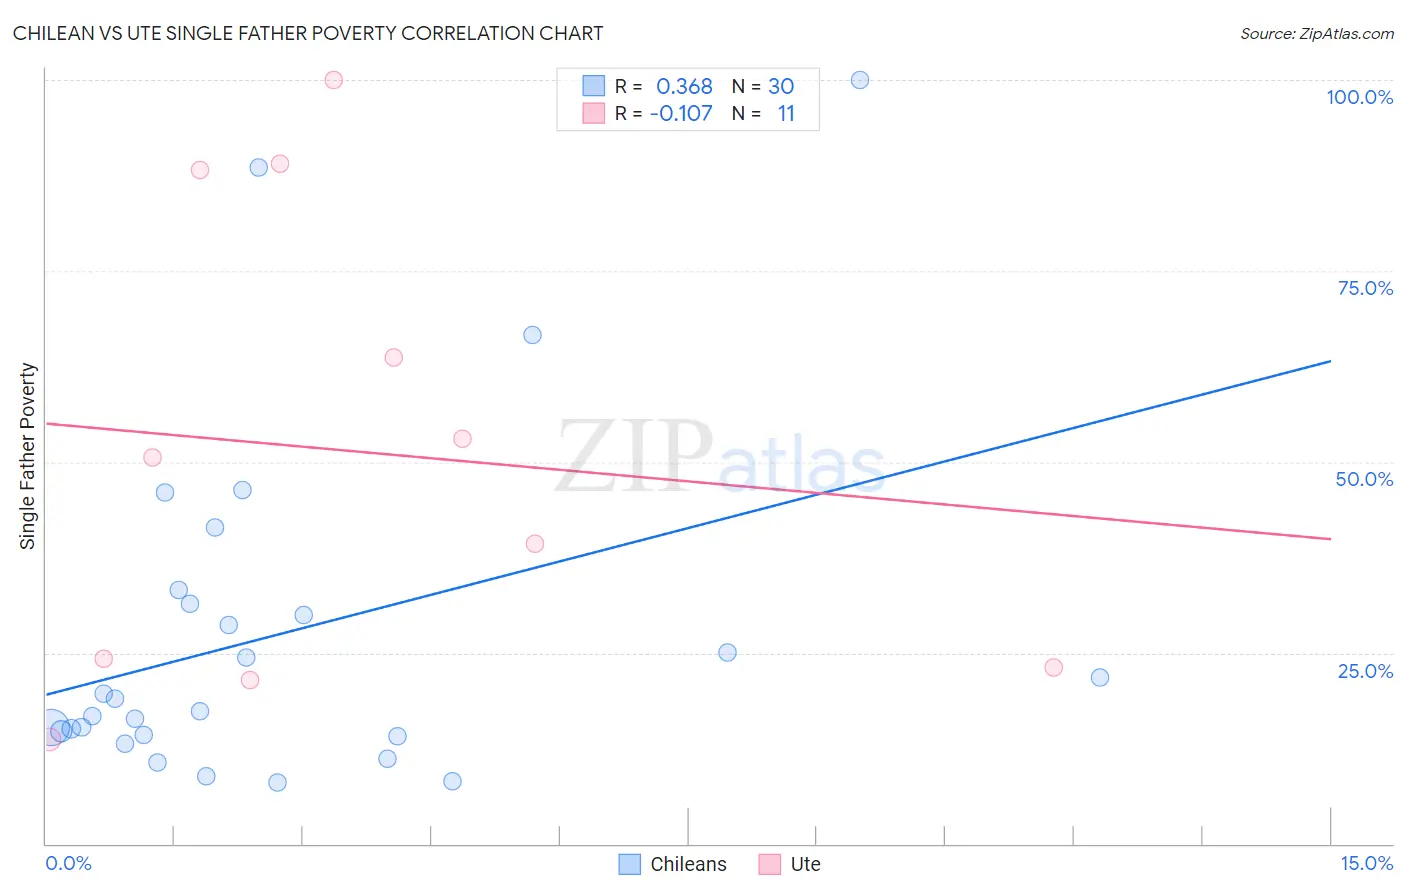
Chilean vs Ute Single Father Poverty Correlation Chart
The statistical analysis conducted on geographies consisting of 214,217,238 people shows a mild positive correlation between the proportion of Chileans and poverty level among single fathers in the United States with a correlation coefficient (R) of 0.368 and weighted average of 15.7%. Similarly, the statistical analysis conducted on geographies consisting of 52,132,597 people shows a poor negative correlation between the proportion of Ute and poverty level among single fathers in the United States with a correlation coefficient (R) of -0.107 and weighted average of 18.5%, a difference of 17.8%.
Single Father Poverty Correlation Summary
| Measurement | Chilean | Ute |
| Minimum | 8.0% | 13.7% |
| Maximum | 100.0% | 100.0% |
| Range | 92.0% | 86.3% |
| Mean | 27.3% | 51.5% |
| Median | 18.2% | 50.6% |
| Interquartile 25% (IQ1) | 14.2% | 23.1% |
| Interquartile 75% (IQ3) | 31.4% | 88.2% |
| Interquartile Range (IQR) | 17.2% | 65.1% |
| Standard Deviation (Sample) | 22.6% | 30.5% |
| Standard Deviation (Population) | 22.2% | 29.1% |
Similar Demographics by Single Father Poverty
Demographics Similar to Chileans by Single Father Poverty
In terms of single father poverty, the demographic groups most similar to Chileans are South American Indian (15.7%, a difference of 0.060%), Australian (15.7%, a difference of 0.080%), Immigrants from Australia (15.7%, a difference of 0.10%), Fijian (15.7%, a difference of 0.16%), and Immigrants from Poland (15.7%, a difference of 0.17%).
| Demographics | Rating | Rank | Single Father Poverty |
| Immigrants | Kazakhstan | 98.2 /100 | #95 | Exceptional 15.6% |
| Immigrants | Belgium | 98.1 /100 | #96 | Exceptional 15.6% |
| Yaqui | 98.1 /100 | #97 | Exceptional 15.6% |
| Zimbabweans | 98.1 /100 | #98 | Exceptional 15.6% |
| Immigrants | Middle Africa | 97.4 /100 | #99 | Exceptional 15.6% |
| Immigrants | Chile | 96.9 /100 | #100 | Exceptional 15.7% |
| Fijians | 96.8 /100 | #101 | Exceptional 15.7% |
| Chileans | 96.4 /100 | #102 | Exceptional 15.7% |
| South American Indians | 96.2 /100 | #103 | Exceptional 15.7% |
| Australians | 96.1 /100 | #104 | Exceptional 15.7% |
| Immigrants | Australia | 96.1 /100 | #105 | Exceptional 15.7% |
| Immigrants | Poland | 95.8 /100 | #106 | Exceptional 15.7% |
| Native Hawaiians | 95.8 /100 | #107 | Exceptional 15.7% |
| Pakistanis | 95.7 /100 | #108 | Exceptional 15.7% |
| Turks | 95.1 /100 | #109 | Exceptional 15.8% |
Demographics Similar to Ute by Single Father Poverty
In terms of single father poverty, the demographic groups most similar to Ute are Blackfeet (18.5%, a difference of 0.050%), Celtic (18.5%, a difference of 0.14%), Comanche (18.5%, a difference of 0.18%), Scotch-Irish (18.6%, a difference of 0.27%), and Hungarian (18.5%, a difference of 0.29%).
| Demographics | Rating | Rank | Single Father Poverty |
| French | 0.0 /100 | #297 | Tragic 18.2% |
| Africans | 0.0 /100 | #298 | Tragic 18.3% |
| Whites/Caucasians | 0.0 /100 | #299 | Tragic 18.4% |
| Immigrants | Dominican Republic | 0.0 /100 | #300 | Tragic 18.4% |
| Hungarians | 0.0 /100 | #301 | Tragic 18.5% |
| Comanche | 0.0 /100 | #302 | Tragic 18.5% |
| Celtics | 0.0 /100 | #303 | Tragic 18.5% |
| Ute | 0.0 /100 | #304 | Tragic 18.5% |
| Blackfeet | 0.0 /100 | #305 | Tragic 18.5% |
| Scotch-Irish | 0.0 /100 | #306 | Tragic 18.6% |
| French Canadians | 0.0 /100 | #307 | Tragic 18.6% |
| Ottawa | 0.0 /100 | #308 | Tragic 18.6% |
| Immigrants | Micronesia | 0.0 /100 | #309 | Tragic 18.6% |
| Chippewa | 0.0 /100 | #310 | Tragic 18.8% |
| Immigrants | Nonimmigrants | 0.0 /100 | #311 | Tragic 18.8% |