Cambodian vs New Zealander Single Father Poverty
COMPARE
Cambodian
New Zealander
Single Father Poverty
Single Father Poverty Comparison
Cambodians
New Zealanders
16.4%
SINGLE FATHER POVERTY
34.6/ 100
METRIC RATING
184th/ 347
METRIC RANK
16.6%
SINGLE FATHER POVERTY
13.7/ 100
METRIC RATING
207th/ 347
METRIC RANK
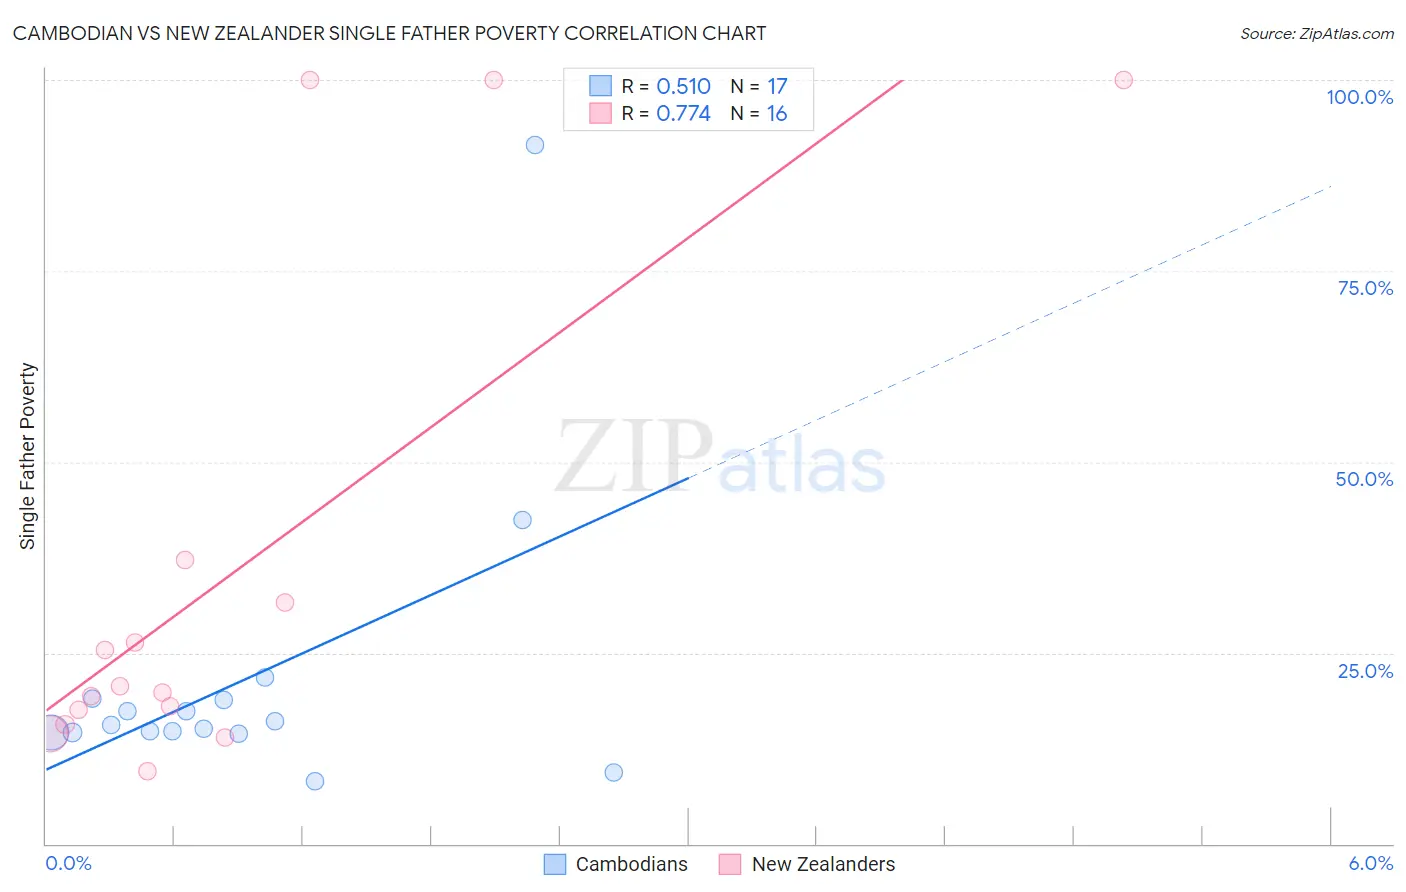
Cambodian vs New Zealander Single Father Poverty Correlation Chart
The statistical analysis conducted on geographies consisting of 91,317,365 people shows a substantial positive correlation between the proportion of Cambodians and poverty level among single fathers in the United States with a correlation coefficient (R) of 0.510 and weighted average of 16.4%. Similarly, the statistical analysis conducted on geographies consisting of 95,950,950 people shows a strong positive correlation between the proportion of New Zealanders and poverty level among single fathers in the United States with a correlation coefficient (R) of 0.774 and weighted average of 16.6%, a difference of 1.3%.
Single Father Poverty Correlation Summary
| Measurement | Cambodian | New Zealander |
| Minimum | 8.1% | 9.5% |
| Maximum | 91.5% | 100.0% |
| Range | 83.4% | 90.5% |
| Mean | 21.5% | 35.6% |
| Median | 15.6% | 20.2% |
| Interquartile 25% (IQ1) | 14.5% | 16.6% |
| Interquartile 75% (IQ3) | 18.9% | 34.4% |
| Interquartile Range (IQR) | 4.4% | 17.8% |
| Standard Deviation (Sample) | 19.5% | 32.7% |
| Standard Deviation (Population) | 18.9% | 31.7% |
Similar Demographics by Single Father Poverty
Demographics Similar to Cambodians by Single Father Poverty
In terms of single father poverty, the demographic groups most similar to Cambodians are Aleut (16.4%, a difference of 0.030%), Immigrants from Italy (16.4%, a difference of 0.050%), Panamanian (16.4%, a difference of 0.050%), Immigrants from Western Africa (16.4%, a difference of 0.060%), and Immigrants from Latin America (16.4%, a difference of 0.12%).
| Demographics | Rating | Rank | Single Father Poverty |
| Immigrants | South Africa | 44.2 /100 | #177 | Average 16.3% |
| Immigrants | Cuba | 41.6 /100 | #178 | Average 16.4% |
| Serbians | 40.9 /100 | #179 | Average 16.4% |
| Immigrants | Latin America | 37.2 /100 | #180 | Fair 16.4% |
| Immigrants | Western Africa | 36.0 /100 | #181 | Fair 16.4% |
| Immigrants | Italy | 35.7 /100 | #182 | Fair 16.4% |
| Aleuts | 35.3 /100 | #183 | Fair 16.4% |
| Cambodians | 34.6 /100 | #184 | Fair 16.4% |
| Panamanians | 33.6 /100 | #185 | Fair 16.4% |
| Immigrants | Venezuela | 31.0 /100 | #186 | Fair 16.4% |
| Ukrainians | 30.4 /100 | #187 | Fair 16.4% |
| Russians | 30.1 /100 | #188 | Fair 16.4% |
| Latvians | 28.9 /100 | #189 | Fair 16.5% |
| Immigrants | Burma/Myanmar | 28.0 /100 | #190 | Fair 16.5% |
| Immigrants | Guyana | 27.1 /100 | #191 | Fair 16.5% |
Demographics Similar to New Zealanders by Single Father Poverty
In terms of single father poverty, the demographic groups most similar to New Zealanders are Immigrants from Senegal (16.6%, a difference of 0.0%), Eastern European (16.6%, a difference of 0.0%), European (16.6%, a difference of 0.040%), Venezuelan (16.6%, a difference of 0.050%), and Guatemalan (16.6%, a difference of 0.070%).
| Demographics | Rating | Rank | Single Father Poverty |
| Syrians | 17.4 /100 | #200 | Poor 16.6% |
| Cubans | 16.5 /100 | #201 | Poor 16.6% |
| Immigrants | Croatia | 16.5 /100 | #202 | Poor 16.6% |
| Immigrants | North America | 15.1 /100 | #203 | Poor 16.6% |
| Immigrants | Guatemala | 14.8 /100 | #204 | Poor 16.6% |
| Venezuelans | 14.3 /100 | #205 | Poor 16.6% |
| Immigrants | Senegal | 13.7 /100 | #206 | Poor 16.6% |
| New Zealanders | 13.7 /100 | #207 | Poor 16.6% |
| Eastern Europeans | 13.7 /100 | #208 | Poor 16.6% |
| Europeans | 13.2 /100 | #209 | Poor 16.6% |
| Guatemalans | 12.9 /100 | #210 | Poor 16.6% |
| Arabs | 12.8 /100 | #211 | Poor 16.6% |
| Immigrants | Southern Europe | 11.2 /100 | #212 | Poor 16.7% |
| Ghanaians | 11.0 /100 | #213 | Poor 16.7% |
| Spanish | 10.7 /100 | #214 | Poor 16.7% |