Immigrants from Sierra Leone vs Ute Single Father Poverty
COMPARE
Immigrants from Sierra Leone
Ute
Single Father Poverty
Single Father Poverty Comparison
Immigrants from Sierra Leone
Ute
16.3%
SINGLE FATHER POVERTY
50.1/ 100
METRIC RATING
172nd/ 347
METRIC RANK
18.5%
SINGLE FATHER POVERTY
0.0/ 100
METRIC RATING
304th/ 347
METRIC RANK
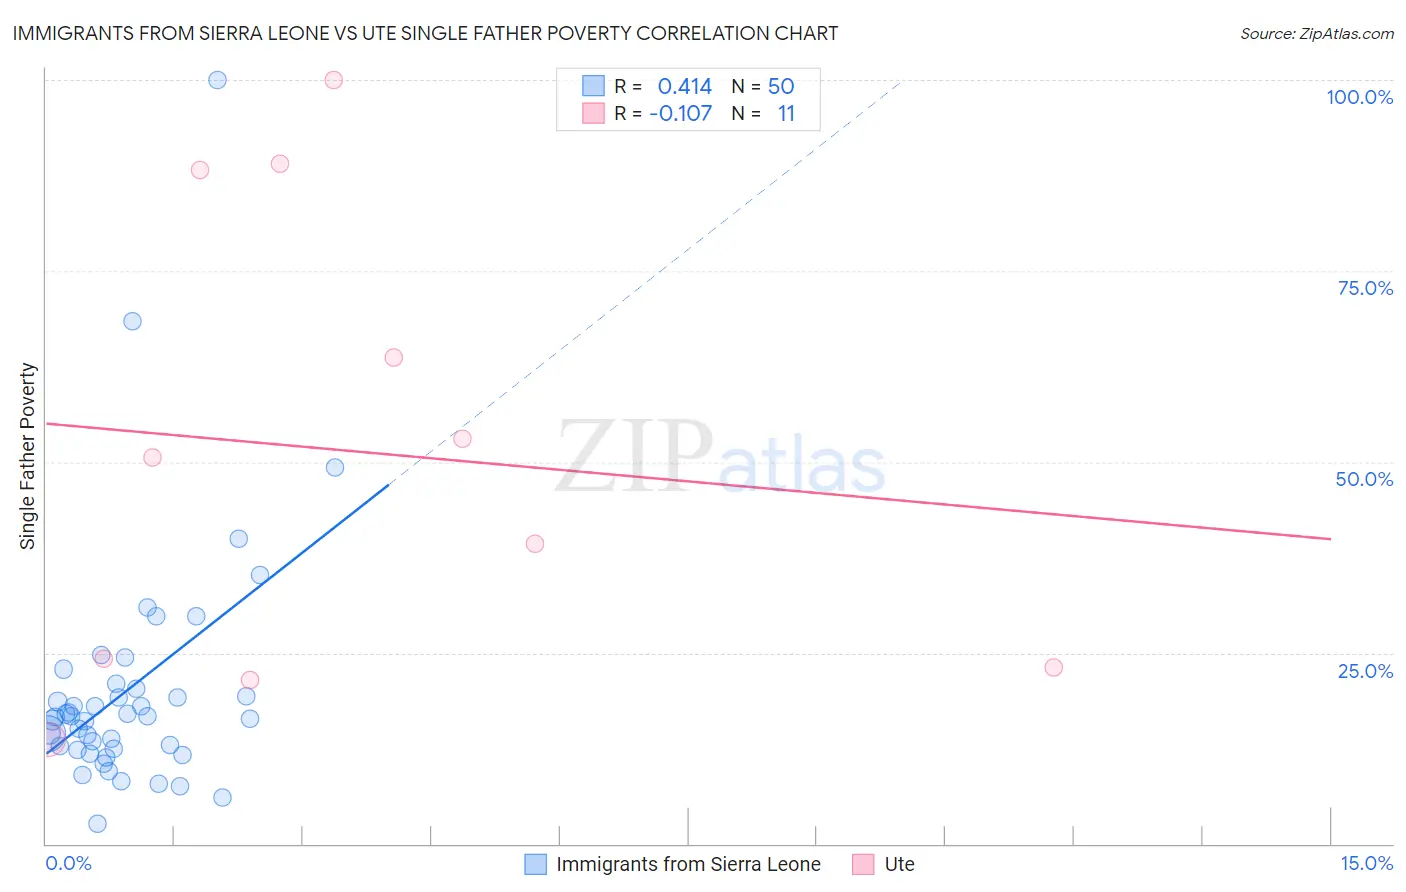
Immigrants from Sierra Leone vs Ute Single Father Poverty Correlation Chart
The statistical analysis conducted on geographies consisting of 92,656,133 people shows a moderate positive correlation between the proportion of Immigrants from Sierra Leone and poverty level among single fathers in the United States with a correlation coefficient (R) of 0.414 and weighted average of 16.3%. Similarly, the statistical analysis conducted on geographies consisting of 52,132,597 people shows a poor negative correlation between the proportion of Ute and poverty level among single fathers in the United States with a correlation coefficient (R) of -0.107 and weighted average of 18.5%, a difference of 13.6%.
Single Father Poverty Correlation Summary
| Measurement | Immigrants from Sierra Leone | Ute |
| Minimum | 2.7% | 13.7% |
| Maximum | 100.0% | 100.0% |
| Range | 97.3% | 86.3% |
| Mean | 20.2% | 51.5% |
| Median | 16.6% | 50.6% |
| Interquartile 25% (IQ1) | 12.4% | 23.1% |
| Interquartile 75% (IQ3) | 20.3% | 88.2% |
| Interquartile Range (IQR) | 7.9% | 65.1% |
| Standard Deviation (Sample) | 16.0% | 30.5% |
| Standard Deviation (Population) | 15.9% | 29.1% |
Similar Demographics by Single Father Poverty
Demographics Similar to Immigrants from Sierra Leone by Single Father Poverty
In terms of single father poverty, the demographic groups most similar to Immigrants from Sierra Leone are Immigrants from St. Vincent and the Grenadines (16.3%, a difference of 0.0%), Swedish (16.3%, a difference of 0.0%), Immigrants from Ecuador (16.3%, a difference of 0.020%), Immigrants from Morocco (16.3%, a difference of 0.030%), and Vietnamese (16.3%, a difference of 0.090%).
| Demographics | Rating | Rank | Single Father Poverty |
| Immigrants | Bangladesh | 55.1 /100 | #165 | Average 16.3% |
| Immigrants | Europe | 54.8 /100 | #166 | Average 16.3% |
| Yugoslavians | 53.9 /100 | #167 | Average 16.3% |
| Costa Ricans | 53.6 /100 | #168 | Average 16.3% |
| Northern Europeans | 52.8 /100 | #169 | Average 16.3% |
| Scandinavians | 52.3 /100 | #170 | Average 16.3% |
| Immigrants | Morocco | 50.7 /100 | #171 | Average 16.3% |
| Immigrants | Sierra Leone | 50.1 /100 | #172 | Average 16.3% |
| Immigrants | St. Vincent and the Grenadines | 50.0 /100 | #173 | Average 16.3% |
| Swedes | 50.0 /100 | #174 | Average 16.3% |
| Immigrants | Ecuador | 49.7 /100 | #175 | Average 16.3% |
| Vietnamese | 48.0 /100 | #176 | Average 16.3% |
| Immigrants | South Africa | 44.2 /100 | #177 | Average 16.3% |
| Immigrants | Cuba | 41.6 /100 | #178 | Average 16.4% |
| Serbians | 40.9 /100 | #179 | Average 16.4% |
Demographics Similar to Ute by Single Father Poverty
In terms of single father poverty, the demographic groups most similar to Ute are Blackfeet (18.5%, a difference of 0.050%), Celtic (18.5%, a difference of 0.14%), Comanche (18.5%, a difference of 0.18%), Scotch-Irish (18.6%, a difference of 0.27%), and Hungarian (18.5%, a difference of 0.29%).
| Demographics | Rating | Rank | Single Father Poverty |
| French | 0.0 /100 | #297 | Tragic 18.2% |
| Africans | 0.0 /100 | #298 | Tragic 18.3% |
| Whites/Caucasians | 0.0 /100 | #299 | Tragic 18.4% |
| Immigrants | Dominican Republic | 0.0 /100 | #300 | Tragic 18.4% |
| Hungarians | 0.0 /100 | #301 | Tragic 18.5% |
| Comanche | 0.0 /100 | #302 | Tragic 18.5% |
| Celtics | 0.0 /100 | #303 | Tragic 18.5% |
| Ute | 0.0 /100 | #304 | Tragic 18.5% |
| Blackfeet | 0.0 /100 | #305 | Tragic 18.5% |
| Scotch-Irish | 0.0 /100 | #306 | Tragic 18.6% |
| French Canadians | 0.0 /100 | #307 | Tragic 18.6% |
| Ottawa | 0.0 /100 | #308 | Tragic 18.6% |
| Immigrants | Micronesia | 0.0 /100 | #309 | Tragic 18.6% |
| Chippewa | 0.0 /100 | #310 | Tragic 18.8% |
| Immigrants | Nonimmigrants | 0.0 /100 | #311 | Tragic 18.8% |