Cambodian vs Macedonian Single Father Poverty
COMPARE
Cambodian
Macedonian
Single Father Poverty
Single Father Poverty Comparison
Cambodians
Macedonians
16.4%
SINGLE FATHER POVERTY
34.6/ 100
METRIC RATING
184th/ 347
METRIC RANK
17.7%
SINGLE FATHER POVERTY
0.1/ 100
METRIC RATING
274th/ 347
METRIC RANK
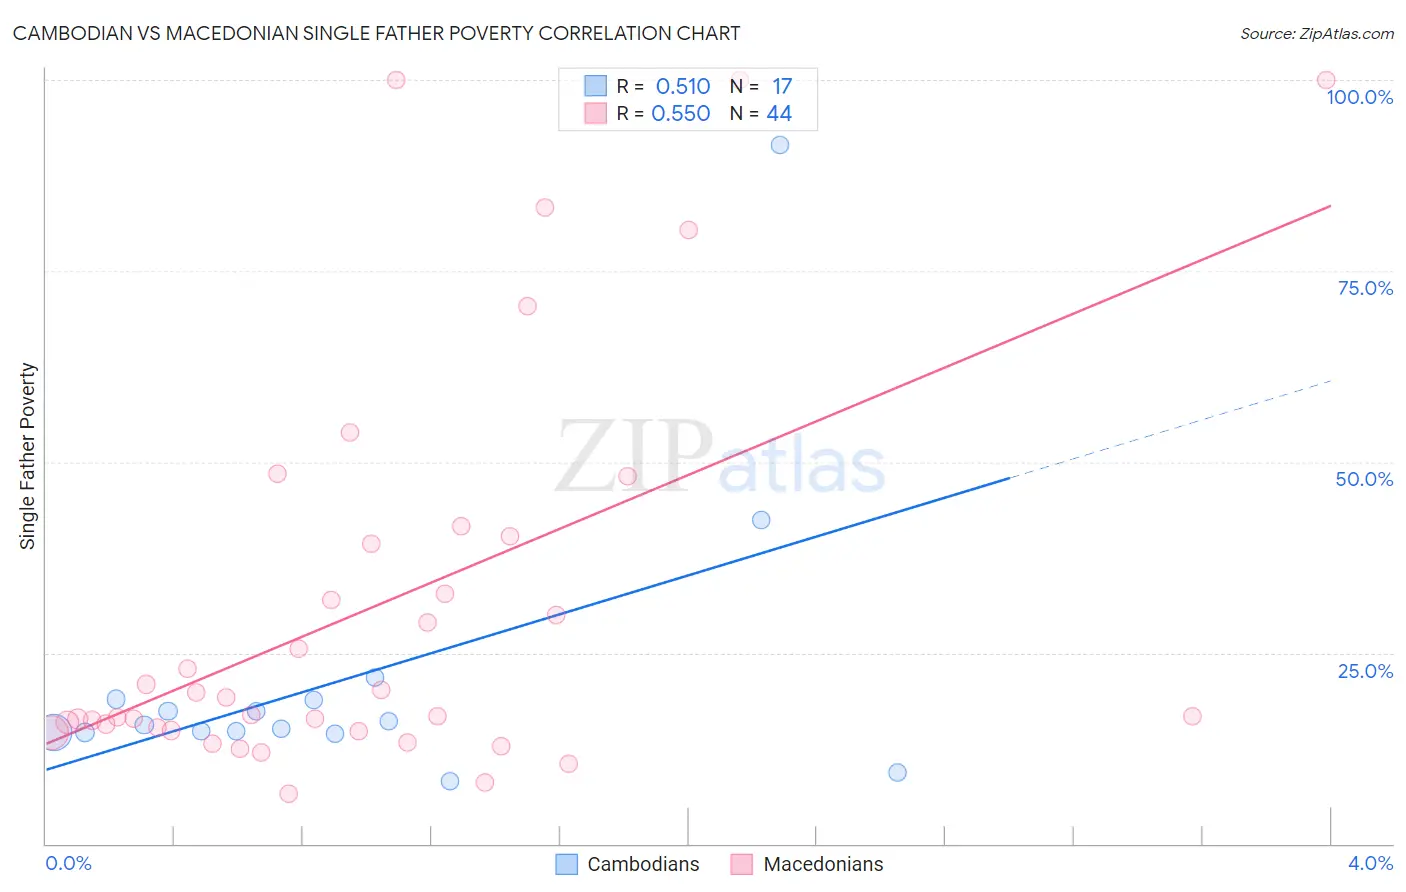
Cambodian vs Macedonian Single Father Poverty Correlation Chart
The statistical analysis conducted on geographies consisting of 91,317,365 people shows a substantial positive correlation between the proportion of Cambodians and poverty level among single fathers in the United States with a correlation coefficient (R) of 0.510 and weighted average of 16.4%. Similarly, the statistical analysis conducted on geographies consisting of 112,665,008 people shows a substantial positive correlation between the proportion of Macedonians and poverty level among single fathers in the United States with a correlation coefficient (R) of 0.550 and weighted average of 17.7%, a difference of 7.6%.
Single Father Poverty Correlation Summary
| Measurement | Cambodian | Macedonian |
| Minimum | 8.1% | 6.6% |
| Maximum | 91.5% | 100.0% |
| Range | 83.4% | 93.4% |
| Mean | 21.5% | 31.1% |
| Median | 15.6% | 18.0% |
| Interquartile 25% (IQ1) | 14.5% | 15.0% |
| Interquartile 75% (IQ3) | 18.9% | 39.8% |
| Interquartile Range (IQR) | 4.4% | 24.8% |
| Standard Deviation (Sample) | 19.5% | 26.1% |
| Standard Deviation (Population) | 18.9% | 25.8% |
Similar Demographics by Single Father Poverty
Demographics Similar to Cambodians by Single Father Poverty
In terms of single father poverty, the demographic groups most similar to Cambodians are Aleut (16.4%, a difference of 0.030%), Immigrants from Italy (16.4%, a difference of 0.050%), Panamanian (16.4%, a difference of 0.050%), Immigrants from Western Africa (16.4%, a difference of 0.060%), and Immigrants from Latin America (16.4%, a difference of 0.12%).
| Demographics | Rating | Rank | Single Father Poverty |
| Immigrants | South Africa | 44.2 /100 | #177 | Average 16.3% |
| Immigrants | Cuba | 41.6 /100 | #178 | Average 16.4% |
| Serbians | 40.9 /100 | #179 | Average 16.4% |
| Immigrants | Latin America | 37.2 /100 | #180 | Fair 16.4% |
| Immigrants | Western Africa | 36.0 /100 | #181 | Fair 16.4% |
| Immigrants | Italy | 35.7 /100 | #182 | Fair 16.4% |
| Aleuts | 35.3 /100 | #183 | Fair 16.4% |
| Cambodians | 34.6 /100 | #184 | Fair 16.4% |
| Panamanians | 33.6 /100 | #185 | Fair 16.4% |
| Immigrants | Venezuela | 31.0 /100 | #186 | Fair 16.4% |
| Ukrainians | 30.4 /100 | #187 | Fair 16.4% |
| Russians | 30.1 /100 | #188 | Fair 16.4% |
| Latvians | 28.9 /100 | #189 | Fair 16.5% |
| Immigrants | Burma/Myanmar | 28.0 /100 | #190 | Fair 16.5% |
| Immigrants | Guyana | 27.1 /100 | #191 | Fair 16.5% |
Demographics Similar to Macedonians by Single Father Poverty
In terms of single father poverty, the demographic groups most similar to Macedonians are British West Indian (17.7%, a difference of 0.070%), German Russian (17.7%, a difference of 0.13%), Lebanese (17.7%, a difference of 0.28%), German (17.7%, a difference of 0.29%), and Iroquois (17.7%, a difference of 0.43%).
| Demographics | Rating | Rank | Single Father Poverty |
| Haitians | 0.3 /100 | #267 | Tragic 17.3% |
| Immigrants | Caribbean | 0.3 /100 | #268 | Tragic 17.4% |
| Slavs | 0.3 /100 | #269 | Tragic 17.4% |
| Indonesians | 0.2 /100 | #270 | Tragic 17.4% |
| French American Indians | 0.2 /100 | #271 | Tragic 17.4% |
| Barbadians | 0.1 /100 | #272 | Tragic 17.5% |
| Italians | 0.1 /100 | #273 | Tragic 17.5% |
| Macedonians | 0.1 /100 | #274 | Tragic 17.7% |
| British West Indians | 0.0 /100 | #275 | Tragic 17.7% |
| German Russians | 0.0 /100 | #276 | Tragic 17.7% |
| Lebanese | 0.0 /100 | #277 | Tragic 17.7% |
| Germans | 0.0 /100 | #278 | Tragic 17.7% |
| Iroquois | 0.0 /100 | #279 | Tragic 17.7% |
| Scottish | 0.0 /100 | #280 | Tragic 17.7% |
| English | 0.0 /100 | #281 | Tragic 17.8% |