Cambodian vs Immigrants from Hungary Single Father Poverty
COMPARE
Cambodian
Immigrants from Hungary
Single Father Poverty
Single Father Poverty Comparison
Cambodians
Immigrants from Hungary
16.4%
SINGLE FATHER POVERTY
34.6/ 100
METRIC RATING
184th/ 347
METRIC RANK
16.1%
SINGLE FATHER POVERTY
78.3/ 100
METRIC RATING
146th/ 347
METRIC RANK
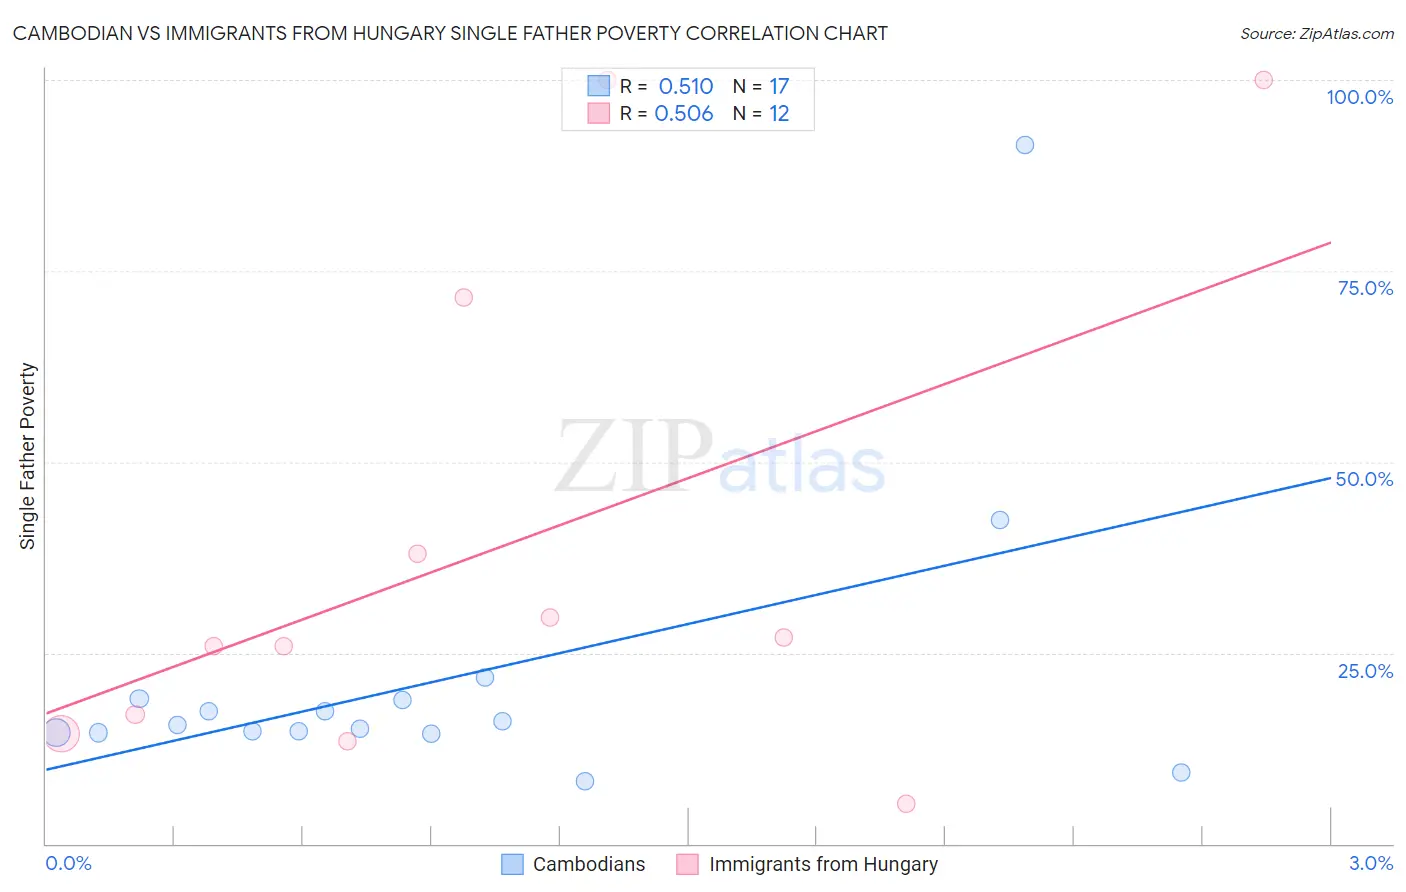
Cambodian vs Immigrants from Hungary Single Father Poverty Correlation Chart
The statistical analysis conducted on geographies consisting of 91,317,365 people shows a substantial positive correlation between the proportion of Cambodians and poverty level among single fathers in the United States with a correlation coefficient (R) of 0.510 and weighted average of 16.4%. Similarly, the statistical analysis conducted on geographies consisting of 163,698,265 people shows a substantial positive correlation between the proportion of Immigrants from Hungary and poverty level among single fathers in the United States with a correlation coefficient (R) of 0.506 and weighted average of 16.1%, a difference of 2.1%.
Single Father Poverty Correlation Summary
| Measurement | Cambodian | Immigrants from Hungary |
| Minimum | 8.1% | 5.2% |
| Maximum | 91.5% | 100.0% |
| Range | 83.4% | 94.8% |
| Mean | 21.5% | 39.0% |
| Median | 15.6% | 26.4% |
| Interquartile 25% (IQ1) | 14.5% | 15.7% |
| Interquartile 75% (IQ3) | 18.9% | 54.8% |
| Interquartile Range (IQR) | 4.4% | 39.1% |
| Standard Deviation (Sample) | 19.5% | 33.0% |
| Standard Deviation (Population) | 18.9% | 31.6% |
Similar Demographics by Single Father Poverty
Demographics Similar to Cambodians by Single Father Poverty
In terms of single father poverty, the demographic groups most similar to Cambodians are Aleut (16.4%, a difference of 0.030%), Immigrants from Italy (16.4%, a difference of 0.050%), Panamanian (16.4%, a difference of 0.050%), Immigrants from Western Africa (16.4%, a difference of 0.060%), and Immigrants from Latin America (16.4%, a difference of 0.12%).
| Demographics | Rating | Rank | Single Father Poverty |
| Immigrants | South Africa | 44.2 /100 | #177 | Average 16.3% |
| Immigrants | Cuba | 41.6 /100 | #178 | Average 16.4% |
| Serbians | 40.9 /100 | #179 | Average 16.4% |
| Immigrants | Latin America | 37.2 /100 | #180 | Fair 16.4% |
| Immigrants | Western Africa | 36.0 /100 | #181 | Fair 16.4% |
| Immigrants | Italy | 35.7 /100 | #182 | Fair 16.4% |
| Aleuts | 35.3 /100 | #183 | Fair 16.4% |
| Cambodians | 34.6 /100 | #184 | Fair 16.4% |
| Panamanians | 33.6 /100 | #185 | Fair 16.4% |
| Immigrants | Venezuela | 31.0 /100 | #186 | Fair 16.4% |
| Ukrainians | 30.4 /100 | #187 | Fair 16.4% |
| Russians | 30.1 /100 | #188 | Fair 16.4% |
| Latvians | 28.9 /100 | #189 | Fair 16.5% |
| Immigrants | Burma/Myanmar | 28.0 /100 | #190 | Fair 16.5% |
| Immigrants | Guyana | 27.1 /100 | #191 | Fair 16.5% |
Demographics Similar to Immigrants from Hungary by Single Father Poverty
In terms of single father poverty, the demographic groups most similar to Immigrants from Hungary are Colombian (16.1%, a difference of 0.080%), Nigerian (16.1%, a difference of 0.10%), Immigrants from Western Asia (16.0%, a difference of 0.16%), South African (16.1%, a difference of 0.20%), and Immigrants from Kuwait (16.0%, a difference of 0.22%).
| Demographics | Rating | Rank | Single Father Poverty |
| South Americans | 85.9 /100 | #139 | Excellent 16.0% |
| Immigrants | Netherlands | 85.3 /100 | #140 | Excellent 16.0% |
| Liberians | 83.3 /100 | #141 | Excellent 16.0% |
| Immigrants | Mexico | 83.3 /100 | #142 | Excellent 16.0% |
| Immigrants | Central America | 83.1 /100 | #143 | Excellent 16.0% |
| Immigrants | Kuwait | 81.4 /100 | #144 | Excellent 16.0% |
| Immigrants | Western Asia | 80.7 /100 | #145 | Excellent 16.0% |
| Immigrants | Hungary | 78.3 /100 | #146 | Good 16.1% |
| Colombians | 77.1 /100 | #147 | Good 16.1% |
| Nigerians | 76.8 /100 | #148 | Good 16.1% |
| South Africans | 75.1 /100 | #149 | Good 16.1% |
| Jordanians | 74.2 /100 | #150 | Good 16.1% |
| Immigrants | France | 73.1 /100 | #151 | Good 16.1% |
| Immigrants | Zimbabwe | 72.1 /100 | #152 | Good 16.1% |
| Immigrants | Israel | 72.0 /100 | #153 | Good 16.1% |