Honduran vs New Zealander Single Father Poverty
COMPARE
Honduran
New Zealander
Single Father Poverty
Single Father Poverty Comparison
Hondurans
New Zealanders
17.0%
SINGLE FATHER POVERTY
1.6/ 100
METRIC RATING
244th/ 347
METRIC RANK
16.6%
SINGLE FATHER POVERTY
13.7/ 100
METRIC RATING
207th/ 347
METRIC RANK
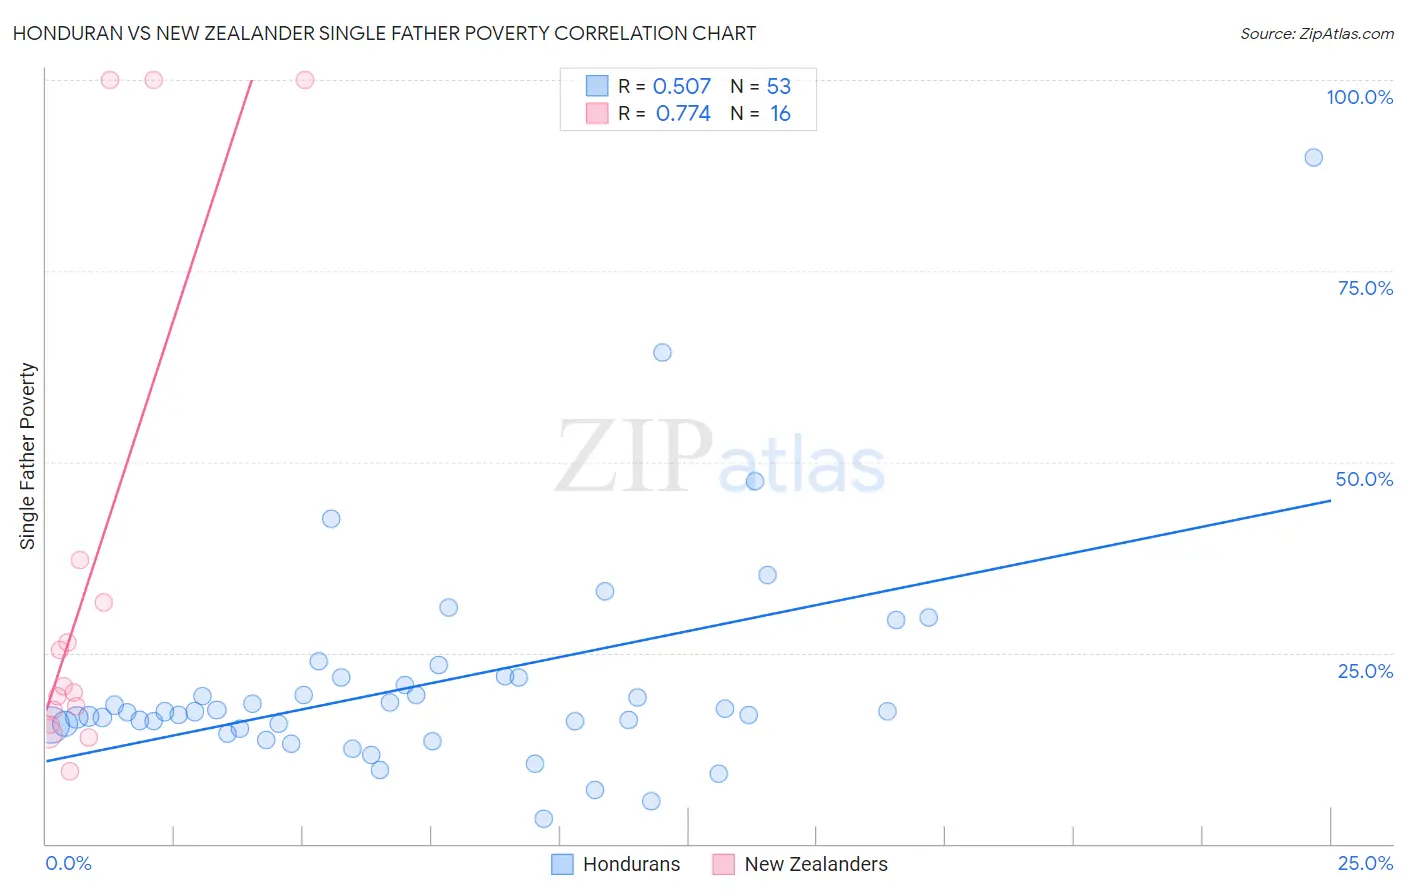
Honduran vs New Zealander Single Father Poverty Correlation Chart
The statistical analysis conducted on geographies consisting of 295,716,434 people shows a substantial positive correlation between the proportion of Hondurans and poverty level among single fathers in the United States with a correlation coefficient (R) of 0.507 and weighted average of 17.0%. Similarly, the statistical analysis conducted on geographies consisting of 95,950,950 people shows a strong positive correlation between the proportion of New Zealanders and poverty level among single fathers in the United States with a correlation coefficient (R) of 0.774 and weighted average of 16.6%, a difference of 2.5%.
Single Father Poverty Correlation Summary
| Measurement | Honduran | New Zealander |
| Minimum | 3.3% | 9.5% |
| Maximum | 89.9% | 100.0% |
| Range | 86.6% | 90.5% |
| Mean | 20.9% | 35.6% |
| Median | 17.3% | 20.2% |
| Interquartile 25% (IQ1) | 15.3% | 16.6% |
| Interquartile 75% (IQ3) | 21.8% | 34.4% |
| Interquartile Range (IQR) | 6.5% | 17.8% |
| Standard Deviation (Sample) | 14.1% | 32.7% |
| Standard Deviation (Population) | 14.0% | 31.7% |
Similar Demographics by Single Father Poverty
Demographics Similar to Hondurans by Single Father Poverty
In terms of single father poverty, the demographic groups most similar to Hondurans are Immigrants from Cabo Verde (17.0%, a difference of 0.020%), Trinidadian and Tobagonian (17.0%, a difference of 0.040%), Immigrants from Ireland (17.1%, a difference of 0.080%), Greek (17.1%, a difference of 0.18%), and Czechoslovakian (17.1%, a difference of 0.18%).
| Demographics | Rating | Rank | Single Father Poverty |
| Sub-Saharan Africans | 2.9 /100 | #237 | Tragic 16.9% |
| Immigrants | Saudi Arabia | 2.7 /100 | #238 | Tragic 16.9% |
| Bermudans | 2.6 /100 | #239 | Tragic 16.9% |
| Finns | 2.6 /100 | #240 | Tragic 16.9% |
| Czechs | 2.3 /100 | #241 | Tragic 17.0% |
| Moroccans | 2.1 /100 | #242 | Tragic 17.0% |
| Immigrants | Cabo Verde | 1.6 /100 | #243 | Tragic 17.0% |
| Hondurans | 1.6 /100 | #244 | Tragic 17.0% |
| Trinidadians and Tobagonians | 1.5 /100 | #245 | Tragic 17.0% |
| Immigrants | Ireland | 1.4 /100 | #246 | Tragic 17.1% |
| Greeks | 1.3 /100 | #247 | Tragic 17.1% |
| Czechoslovakians | 1.3 /100 | #248 | Tragic 17.1% |
| Canadians | 1.3 /100 | #249 | Tragic 17.1% |
| Austrians | 1.1 /100 | #250 | Tragic 17.1% |
| Luxembourgers | 1.1 /100 | #251 | Tragic 17.1% |
Demographics Similar to New Zealanders by Single Father Poverty
In terms of single father poverty, the demographic groups most similar to New Zealanders are Immigrants from Senegal (16.6%, a difference of 0.0%), Eastern European (16.6%, a difference of 0.0%), European (16.6%, a difference of 0.040%), Venezuelan (16.6%, a difference of 0.050%), and Guatemalan (16.6%, a difference of 0.070%).
| Demographics | Rating | Rank | Single Father Poverty |
| Syrians | 17.4 /100 | #200 | Poor 16.6% |
| Cubans | 16.5 /100 | #201 | Poor 16.6% |
| Immigrants | Croatia | 16.5 /100 | #202 | Poor 16.6% |
| Immigrants | North America | 15.1 /100 | #203 | Poor 16.6% |
| Immigrants | Guatemala | 14.8 /100 | #204 | Poor 16.6% |
| Venezuelans | 14.3 /100 | #205 | Poor 16.6% |
| Immigrants | Senegal | 13.7 /100 | #206 | Poor 16.6% |
| New Zealanders | 13.7 /100 | #207 | Poor 16.6% |
| Eastern Europeans | 13.7 /100 | #208 | Poor 16.6% |
| Europeans | 13.2 /100 | #209 | Poor 16.6% |
| Guatemalans | 12.9 /100 | #210 | Poor 16.6% |
| Arabs | 12.8 /100 | #211 | Poor 16.6% |
| Immigrants | Southern Europe | 11.2 /100 | #212 | Poor 16.7% |
| Ghanaians | 11.0 /100 | #213 | Poor 16.7% |
| Spanish | 10.7 /100 | #214 | Poor 16.7% |