Cambodian vs New Zealander In Labor Force | Age 20-64
COMPARE
Cambodian
New Zealander
In Labor Force | Age 20-64
In Labor Force | Age 20-64 Comparison
Cambodians
New Zealanders
81.1%
IN LABOR FORCE | AGE 20-64
100.0/ 100
METRIC RATING
14th/ 347
METRIC RANK
79.7%
IN LABOR FORCE | AGE 20-64
69.4/ 100
METRIC RATING
154th/ 347
METRIC RANK
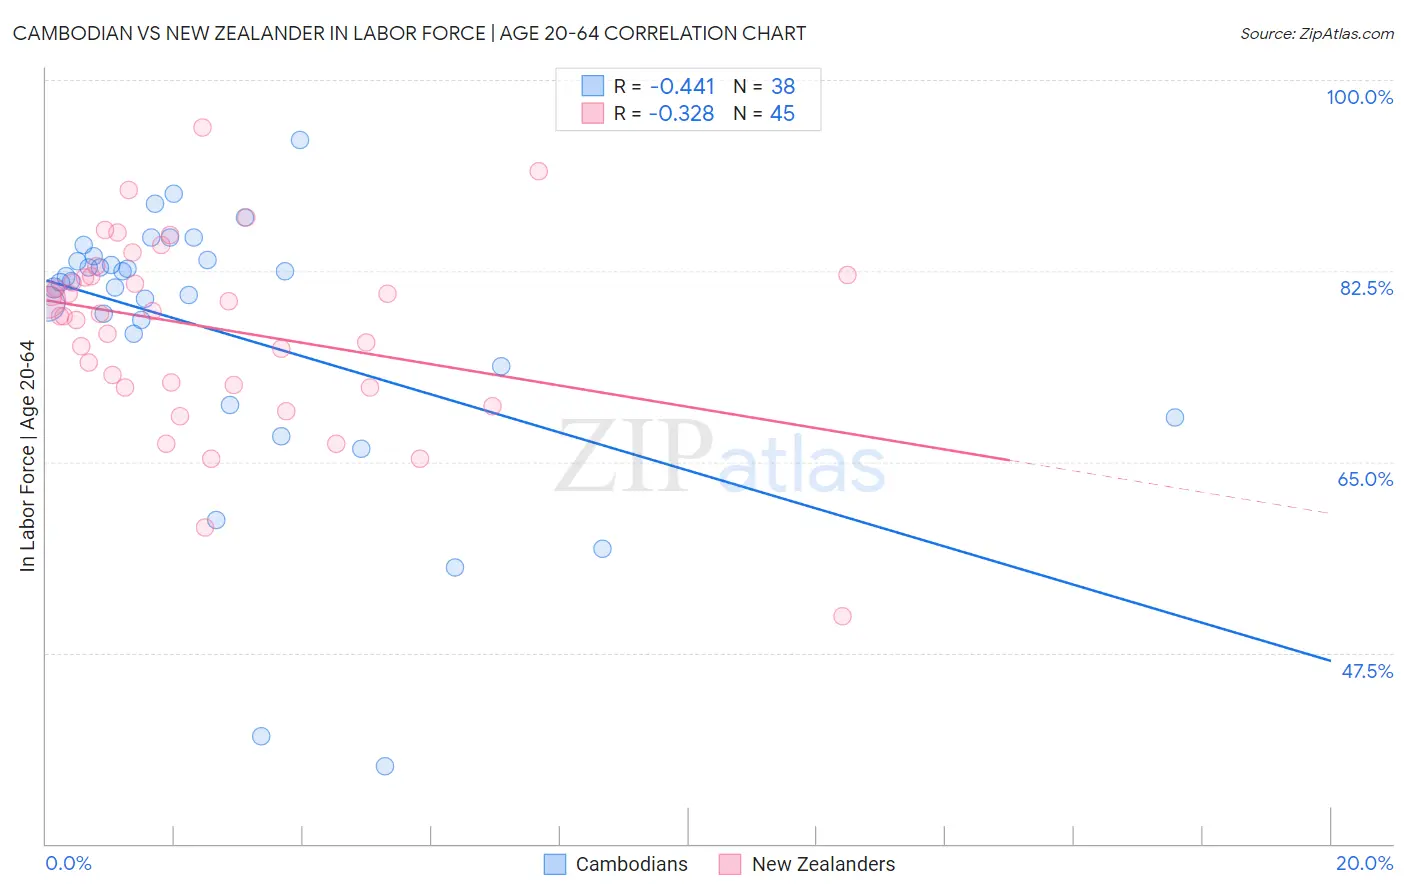
Cambodian vs New Zealander In Labor Force | Age 20-64 Correlation Chart
The statistical analysis conducted on geographies consisting of 102,521,417 people shows a moderate negative correlation between the proportion of Cambodians and labor force participation rate among population between the ages 20 and 64 in the United States with a correlation coefficient (R) of -0.441 and weighted average of 81.1%. Similarly, the statistical analysis conducted on geographies consisting of 106,923,900 people shows a mild negative correlation between the proportion of New Zealanders and labor force participation rate among population between the ages 20 and 64 in the United States with a correlation coefficient (R) of -0.328 and weighted average of 79.7%, a difference of 1.7%.
In Labor Force | Age 20-64 Correlation Summary
| Measurement | Cambodian | New Zealander |
| Minimum | 37.1% | 50.8% |
| Maximum | 94.5% | 95.6% |
| Range | 57.4% | 44.8% |
| Mean | 77.0% | 77.3% |
| Median | 81.5% | 78.6% |
| Interquartile 25% (IQ1) | 73.8% | 72.0% |
| Interquartile 75% (IQ3) | 83.6% | 82.1% |
| Interquartile Range (IQR) | 9.8% | 10.1% |
| Standard Deviation (Sample) | 12.6% | 8.5% |
| Standard Deviation (Population) | 12.5% | 8.4% |
Similar Demographics by In Labor Force | Age 20-64
Demographics Similar to Cambodians by In Labor Force | Age 20-64
In terms of in labor force | age 20-64, the demographic groups most similar to Cambodians are Bulgarian (81.1%, a difference of 0.010%), Immigrants from Nepal (81.1%, a difference of 0.020%), Norwegian (81.0%, a difference of 0.12%), Immigrants from Bulgaria (81.0%, a difference of 0.13%), and Zimbabwean (81.0%, a difference of 0.14%).
| Demographics | Rating | Rank | In Labor Force | Age 20-64 |
| Immigrants | Cameroon | 100.0 /100 | #7 | Exceptional 81.6% |
| Immigrants | Somalia | 100.0 /100 | #8 | Exceptional 81.6% |
| Sierra Leoneans | 100.0 /100 | #9 | Exceptional 81.5% |
| Immigrants | Sierra Leone | 100.0 /100 | #10 | Exceptional 81.5% |
| Immigrants | Eastern Africa | 100.0 /100 | #11 | Exceptional 81.3% |
| Immigrants | Eritrea | 100.0 /100 | #12 | Exceptional 81.3% |
| Immigrants | India | 100.0 /100 | #13 | Exceptional 81.3% |
| Cambodians | 100.0 /100 | #14 | Exceptional 81.1% |
| Bulgarians | 100.0 /100 | #15 | Exceptional 81.1% |
| Immigrants | Nepal | 100.0 /100 | #16 | Exceptional 81.1% |
| Norwegians | 100.0 /100 | #17 | Exceptional 81.0% |
| Immigrants | Bulgaria | 100.0 /100 | #18 | Exceptional 81.0% |
| Zimbabweans | 100.0 /100 | #19 | Exceptional 81.0% |
| Thais | 100.0 /100 | #20 | Exceptional 80.9% |
| Liberians | 100.0 /100 | #21 | Exceptional 80.9% |
Demographics Similar to New Zealanders by In Labor Force | Age 20-64
In terms of in labor force | age 20-64, the demographic groups most similar to New Zealanders are Immigrants from Kazakhstan (79.7%, a difference of 0.0%), Immigrants from South Africa (79.7%, a difference of 0.0%), Senegalese (79.7%, a difference of 0.0%), Immigrants from China (79.7%, a difference of 0.0%), and Immigrants from Northern Europe (79.7%, a difference of 0.020%).
| Demographics | Rating | Rank | In Labor Force | Age 20-64 |
| Immigrants | Philippines | 78.0 /100 | #147 | Good 79.8% |
| Romanians | 77.6 /100 | #148 | Good 79.8% |
| Icelanders | 75.1 /100 | #149 | Good 79.7% |
| Costa Ricans | 72.4 /100 | #150 | Good 79.7% |
| Scandinavians | 72.0 /100 | #151 | Good 79.7% |
| Immigrants | Northern Europe | 72.0 /100 | #152 | Good 79.7% |
| Immigrants | Kazakhstan | 69.5 /100 | #153 | Good 79.7% |
| New Zealanders | 69.4 /100 | #154 | Good 79.7% |
| Immigrants | South Africa | 69.2 /100 | #155 | Good 79.7% |
| Senegalese | 69.1 /100 | #156 | Good 79.7% |
| Immigrants | China | 69.1 /100 | #157 | Good 79.7% |
| Austrians | 67.6 /100 | #158 | Good 79.7% |
| Immigrants | Cuba | 66.7 /100 | #159 | Good 79.7% |
| Moroccans | 66.7 /100 | #160 | Good 79.7% |
| South Africans | 66.2 /100 | #161 | Good 79.7% |