Serbian vs New Zealander Single Father Poverty
COMPARE
Serbian
New Zealander
Single Father Poverty
Single Father Poverty Comparison
Serbians
New Zealanders
16.4%
SINGLE FATHER POVERTY
40.9/ 100
METRIC RATING
179th/ 347
METRIC RANK
16.6%
SINGLE FATHER POVERTY
13.7/ 100
METRIC RATING
207th/ 347
METRIC RANK
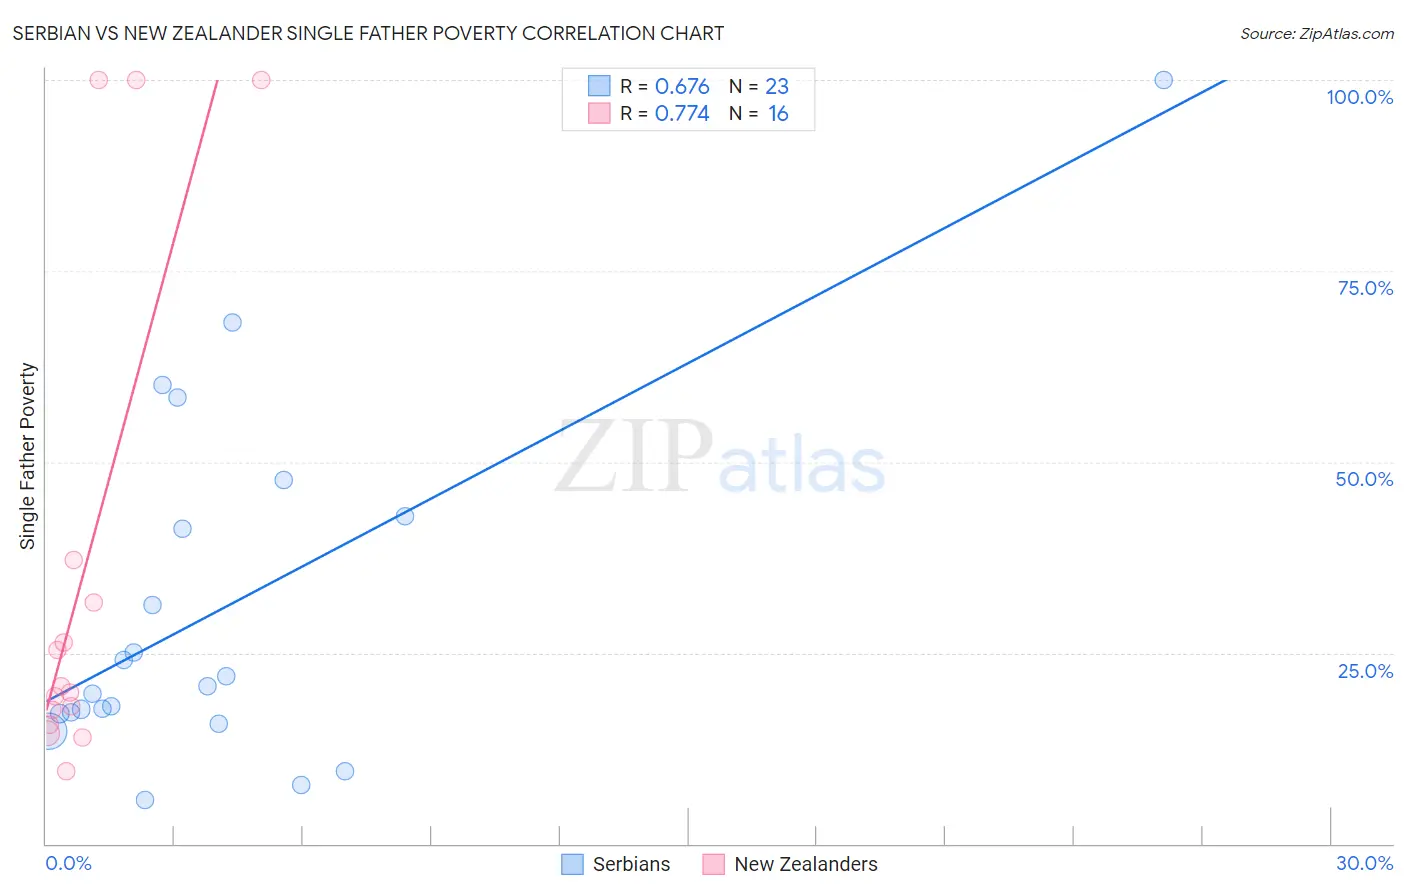
Serbian vs New Zealander Single Father Poverty Correlation Chart
The statistical analysis conducted on geographies consisting of 216,450,025 people shows a significant positive correlation between the proportion of Serbians and poverty level among single fathers in the United States with a correlation coefficient (R) of 0.676 and weighted average of 16.4%. Similarly, the statistical analysis conducted on geographies consisting of 95,950,950 people shows a strong positive correlation between the proportion of New Zealanders and poverty level among single fathers in the United States with a correlation coefficient (R) of 0.774 and weighted average of 16.6%, a difference of 1.6%.
Single Father Poverty Correlation Summary
| Measurement | Serbian | New Zealander |
| Minimum | 5.7% | 9.5% |
| Maximum | 100.0% | 100.0% |
| Range | 94.3% | 90.5% |
| Mean | 30.5% | 35.6% |
| Median | 20.7% | 20.2% |
| Interquartile 25% (IQ1) | 17.0% | 16.6% |
| Interquartile 75% (IQ3) | 42.9% | 34.4% |
| Interquartile Range (IQR) | 25.8% | 17.8% |
| Standard Deviation (Sample) | 23.1% | 32.7% |
| Standard Deviation (Population) | 22.6% | 31.7% |
Similar Demographics by Single Father Poverty
Demographics Similar to Serbians by Single Father Poverty
In terms of single father poverty, the demographic groups most similar to Serbians are Immigrants from Cuba (16.4%, a difference of 0.030%), Immigrants from South Africa (16.3%, a difference of 0.15%), Immigrants from Latin America (16.4%, a difference of 0.17%), Immigrants from Western Africa (16.4%, a difference of 0.23%), and Immigrants from Italy (16.4%, a difference of 0.24%).
| Demographics | Rating | Rank | Single Father Poverty |
| Immigrants | Sierra Leone | 50.1 /100 | #172 | Average 16.3% |
| Immigrants | St. Vincent and the Grenadines | 50.0 /100 | #173 | Average 16.3% |
| Swedes | 50.0 /100 | #174 | Average 16.3% |
| Immigrants | Ecuador | 49.7 /100 | #175 | Average 16.3% |
| Vietnamese | 48.0 /100 | #176 | Average 16.3% |
| Immigrants | South Africa | 44.2 /100 | #177 | Average 16.3% |
| Immigrants | Cuba | 41.6 /100 | #178 | Average 16.4% |
| Serbians | 40.9 /100 | #179 | Average 16.4% |
| Immigrants | Latin America | 37.2 /100 | #180 | Fair 16.4% |
| Immigrants | Western Africa | 36.0 /100 | #181 | Fair 16.4% |
| Immigrants | Italy | 35.7 /100 | #182 | Fair 16.4% |
| Aleuts | 35.3 /100 | #183 | Fair 16.4% |
| Cambodians | 34.6 /100 | #184 | Fair 16.4% |
| Panamanians | 33.6 /100 | #185 | Fair 16.4% |
| Immigrants | Venezuela | 31.0 /100 | #186 | Fair 16.4% |
Demographics Similar to New Zealanders by Single Father Poverty
In terms of single father poverty, the demographic groups most similar to New Zealanders are Immigrants from Senegal (16.6%, a difference of 0.0%), Eastern European (16.6%, a difference of 0.0%), European (16.6%, a difference of 0.040%), Venezuelan (16.6%, a difference of 0.050%), and Guatemalan (16.6%, a difference of 0.070%).
| Demographics | Rating | Rank | Single Father Poverty |
| Syrians | 17.4 /100 | #200 | Poor 16.6% |
| Cubans | 16.5 /100 | #201 | Poor 16.6% |
| Immigrants | Croatia | 16.5 /100 | #202 | Poor 16.6% |
| Immigrants | North America | 15.1 /100 | #203 | Poor 16.6% |
| Immigrants | Guatemala | 14.8 /100 | #204 | Poor 16.6% |
| Venezuelans | 14.3 /100 | #205 | Poor 16.6% |
| Immigrants | Senegal | 13.7 /100 | #206 | Poor 16.6% |
| New Zealanders | 13.7 /100 | #207 | Poor 16.6% |
| Eastern Europeans | 13.7 /100 | #208 | Poor 16.6% |
| Europeans | 13.2 /100 | #209 | Poor 16.6% |
| Guatemalans | 12.9 /100 | #210 | Poor 16.6% |
| Arabs | 12.8 /100 | #211 | Poor 16.6% |
| Immigrants | Southern Europe | 11.2 /100 | #212 | Poor 16.7% |
| Ghanaians | 11.0 /100 | #213 | Poor 16.7% |
| Spanish | 10.7 /100 | #214 | Poor 16.7% |