Cambodian vs New Zealander High School Diploma
COMPARE
Cambodian
New Zealander
High School Diploma
High School Diploma Comparison
Cambodians
New Zealanders
90.8%
HIGH SCHOOL DIPLOMA
99.4/ 100
METRIC RATING
75th/ 347
METRIC RANK
91.1%
HIGH SCHOOL DIPLOMA
99.7/ 100
METRIC RATING
51st/ 347
METRIC RANK
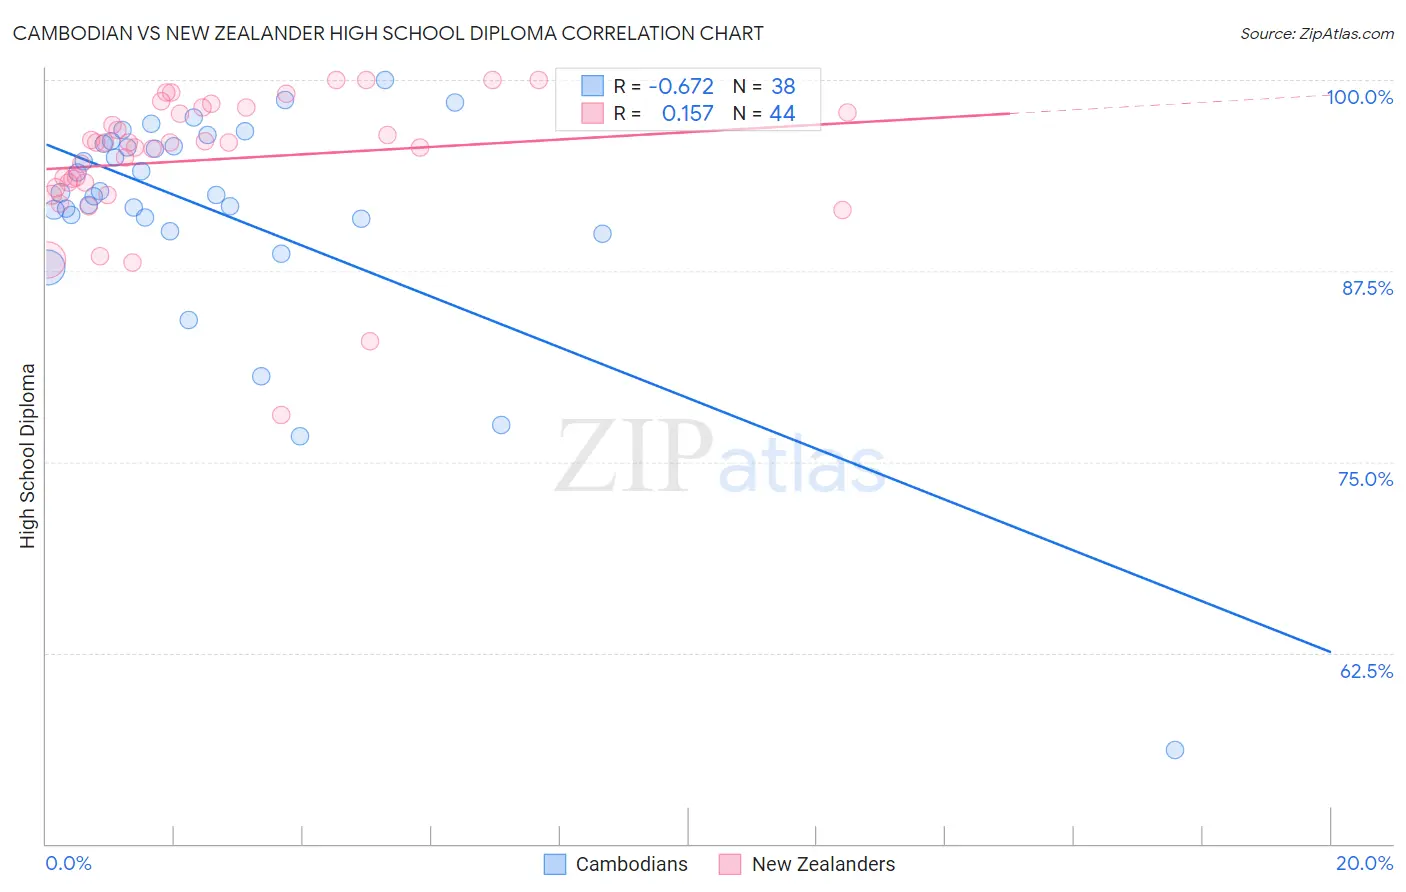
Cambodian vs New Zealander High School Diploma Correlation Chart
The statistical analysis conducted on geographies consisting of 102,514,976 people shows a significant negative correlation between the proportion of Cambodians and percentage of population with at least high school diploma education in the United States with a correlation coefficient (R) of -0.672 and weighted average of 90.8%. Similarly, the statistical analysis conducted on geographies consisting of 106,912,544 people shows a poor positive correlation between the proportion of New Zealanders and percentage of population with at least high school diploma education in the United States with a correlation coefficient (R) of 0.157 and weighted average of 91.1%, a difference of 0.33%.
High School Diploma Correlation Summary
| Measurement | Cambodian | New Zealander |
| Minimum | 56.1% | 78.1% |
| Maximum | 100.0% | 100.0% |
| Range | 43.9% | 21.9% |
| Mean | 91.3% | 94.8% |
| Median | 92.6% | 95.9% |
| Interquartile 25% (IQ1) | 90.9% | 93.1% |
| Interquartile 75% (IQ3) | 95.8% | 98.0% |
| Interquartile Range (IQR) | 4.9% | 4.9% |
| Standard Deviation (Sample) | 7.9% | 4.5% |
| Standard Deviation (Population) | 7.8% | 4.4% |
Similar Demographics by High School Diploma
Demographics Similar to Cambodians by High School Diploma
In terms of high school diploma, the demographic groups most similar to Cambodians are Hungarian (90.8%, a difference of 0.010%), Immigrants from South Central Asia (90.9%, a difference of 0.020%), Immigrants from Czechoslovakia (90.9%, a difference of 0.020%), Native Hawaiian (90.8%, a difference of 0.020%), and Burmese (90.8%, a difference of 0.020%).
| Demographics | Rating | Rank | High School Diploma |
| Czechoslovakians | 99.5 /100 | #68 | Exceptional 90.9% |
| French Canadians | 99.5 /100 | #69 | Exceptional 90.9% |
| Immigrants | Latvia | 99.5 /100 | #70 | Exceptional 90.9% |
| Alaskan Athabascans | 99.4 /100 | #71 | Exceptional 90.9% |
| Soviet Union | 99.4 /100 | #72 | Exceptional 90.9% |
| Immigrants | South Central Asia | 99.4 /100 | #73 | Exceptional 90.9% |
| Immigrants | Czechoslovakia | 99.4 /100 | #74 | Exceptional 90.9% |
| Cambodians | 99.4 /100 | #75 | Exceptional 90.8% |
| Hungarians | 99.3 /100 | #76 | Exceptional 90.8% |
| Native Hawaiians | 99.3 /100 | #77 | Exceptional 90.8% |
| Burmese | 99.3 /100 | #78 | Exceptional 90.8% |
| Immigrants | Denmark | 99.3 /100 | #79 | Exceptional 90.8% |
| Immigrants | England | 99.3 /100 | #80 | Exceptional 90.8% |
| Immigrants | Switzerland | 99.3 /100 | #81 | Exceptional 90.8% |
| Scotch-Irish | 99.2 /100 | #82 | Exceptional 90.8% |
Demographics Similar to New Zealanders by High School Diploma
In terms of high school diploma, the demographic groups most similar to New Zealanders are Immigrants from Sweden (91.1%, a difference of 0.0%), Immigrants from Belgium (91.1%, a difference of 0.0%), Macedonian (91.1%, a difference of 0.020%), Serbian (91.1%, a difference of 0.040%), and Welsh (91.2%, a difference of 0.050%).
| Demographics | Rating | Rank | High School Diploma |
| Immigrants | Austria | 99.8 /100 | #44 | Exceptional 91.3% |
| Turks | 99.8 /100 | #45 | Exceptional 91.2% |
| Greeks | 99.8 /100 | #46 | Exceptional 91.2% |
| Australians | 99.8 /100 | #47 | Exceptional 91.2% |
| Belgians | 99.8 /100 | #48 | Exceptional 91.2% |
| Bhutanese | 99.8 /100 | #49 | Exceptional 91.2% |
| Welsh | 99.8 /100 | #50 | Exceptional 91.2% |
| New Zealanders | 99.7 /100 | #51 | Exceptional 91.1% |
| Immigrants | Sweden | 99.7 /100 | #52 | Exceptional 91.1% |
| Immigrants | Belgium | 99.7 /100 | #53 | Exceptional 91.1% |
| Macedonians | 99.7 /100 | #54 | Exceptional 91.1% |
| Serbians | 99.7 /100 | #55 | Exceptional 91.1% |
| Immigrants | Canada | 99.7 /100 | #56 | Exceptional 91.1% |
| Zimbabweans | 99.7 /100 | #57 | Exceptional 91.1% |
| Slavs | 99.7 /100 | #58 | Exceptional 91.0% |