Immigrants from Nigeria vs New Zealander Single Father Poverty
COMPARE
Immigrants from Nigeria
New Zealander
Single Father Poverty
Single Father Poverty Comparison
Immigrants from Nigeria
New Zealanders
15.9%
SINGLE FATHER POVERTY
90.8/ 100
METRIC RATING
128th/ 347
METRIC RANK
16.6%
SINGLE FATHER POVERTY
13.7/ 100
METRIC RATING
207th/ 347
METRIC RANK
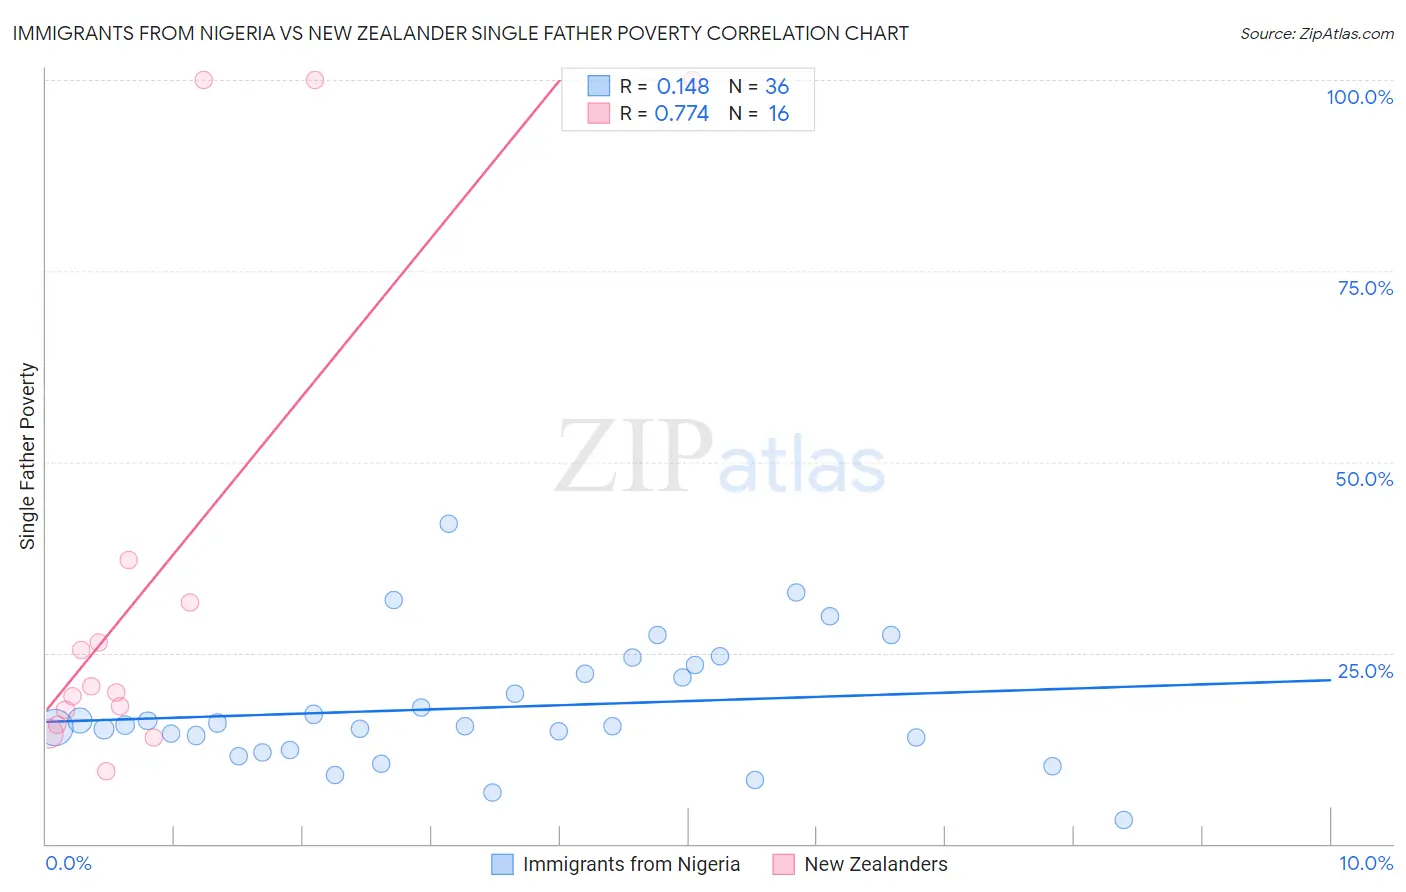
Immigrants from Nigeria vs New Zealander Single Father Poverty Correlation Chart
The statistical analysis conducted on geographies consisting of 237,669,911 people shows a poor positive correlation between the proportion of Immigrants from Nigeria and poverty level among single fathers in the United States with a correlation coefficient (R) of 0.148 and weighted average of 15.9%. Similarly, the statistical analysis conducted on geographies consisting of 95,950,950 people shows a strong positive correlation between the proportion of New Zealanders and poverty level among single fathers in the United States with a correlation coefficient (R) of 0.774 and weighted average of 16.6%, a difference of 4.7%.
Single Father Poverty Correlation Summary
| Measurement | Immigrants from Nigeria | New Zealander |
| Minimum | 3.1% | 9.5% |
| Maximum | 41.8% | 100.0% |
| Range | 38.7% | 90.5% |
| Mean | 17.8% | 35.6% |
| Median | 15.4% | 20.2% |
| Interquartile 25% (IQ1) | 13.1% | 16.6% |
| Interquartile 75% (IQ3) | 22.8% | 34.4% |
| Interquartile Range (IQR) | 9.7% | 17.8% |
| Standard Deviation (Sample) | 8.1% | 32.7% |
| Standard Deviation (Population) | 8.0% | 31.7% |
Similar Demographics by Single Father Poverty
Demographics Similar to Immigrants from Nigeria by Single Father Poverty
In terms of single father poverty, the demographic groups most similar to Immigrants from Nigeria are Immigrants from West Indies (15.9%, a difference of 0.0%), Immigrants from Liberia (15.9%, a difference of 0.030%), Hmong (15.9%, a difference of 0.040%), Iraqi (15.9%, a difference of 0.050%), and Immigrants from Panama (15.9%, a difference of 0.060%).
| Demographics | Rating | Rank | Single Father Poverty |
| Immigrants | Immigrants | 91.9 /100 | #121 | Exceptional 15.9% |
| Sudanese | 91.6 /100 | #122 | Exceptional 15.9% |
| Palestinians | 91.3 /100 | #123 | Exceptional 15.9% |
| Immigrants | Panama | 91.3 /100 | #124 | Exceptional 15.9% |
| Iraqis | 91.2 /100 | #125 | Exceptional 15.9% |
| Hmong | 91.1 /100 | #126 | Exceptional 15.9% |
| Immigrants | Liberia | 91.1 /100 | #127 | Exceptional 15.9% |
| Immigrants | Nigeria | 90.8 /100 | #128 | Exceptional 15.9% |
| Immigrants | West Indies | 90.8 /100 | #129 | Exceptional 15.9% |
| Norwegians | 90.2 /100 | #130 | Exceptional 15.9% |
| Nicaraguans | 90.1 /100 | #131 | Exceptional 15.9% |
| Immigrants | Portugal | 89.7 /100 | #132 | Excellent 15.9% |
| Immigrants | Syria | 89.5 /100 | #133 | Excellent 15.9% |
| Immigrants | South America | 88.5 /100 | #134 | Excellent 15.9% |
| Immigrants | Sri Lanka | 88.2 /100 | #135 | Excellent 15.9% |
Demographics Similar to New Zealanders by Single Father Poverty
In terms of single father poverty, the demographic groups most similar to New Zealanders are Immigrants from Senegal (16.6%, a difference of 0.0%), Eastern European (16.6%, a difference of 0.0%), European (16.6%, a difference of 0.040%), Venezuelan (16.6%, a difference of 0.050%), and Guatemalan (16.6%, a difference of 0.070%).
| Demographics | Rating | Rank | Single Father Poverty |
| Syrians | 17.4 /100 | #200 | Poor 16.6% |
| Cubans | 16.5 /100 | #201 | Poor 16.6% |
| Immigrants | Croatia | 16.5 /100 | #202 | Poor 16.6% |
| Immigrants | North America | 15.1 /100 | #203 | Poor 16.6% |
| Immigrants | Guatemala | 14.8 /100 | #204 | Poor 16.6% |
| Venezuelans | 14.3 /100 | #205 | Poor 16.6% |
| Immigrants | Senegal | 13.7 /100 | #206 | Poor 16.6% |
| New Zealanders | 13.7 /100 | #207 | Poor 16.6% |
| Eastern Europeans | 13.7 /100 | #208 | Poor 16.6% |
| Europeans | 13.2 /100 | #209 | Poor 16.6% |
| Guatemalans | 12.9 /100 | #210 | Poor 16.6% |
| Arabs | 12.8 /100 | #211 | Poor 16.6% |
| Immigrants | Southern Europe | 11.2 /100 | #212 | Poor 16.7% |
| Ghanaians | 11.0 /100 | #213 | Poor 16.7% |
| Spanish | 10.7 /100 | #214 | Poor 16.7% |