Immigrants from Guyana vs New Zealander Single Father Poverty
COMPARE
Immigrants from Guyana
New Zealander
Single Father Poverty
Single Father Poverty Comparison
Immigrants from Guyana
New Zealanders
16.5%
SINGLE FATHER POVERTY
27.1/ 100
METRIC RATING
191st/ 347
METRIC RANK
16.6%
SINGLE FATHER POVERTY
13.7/ 100
METRIC RATING
207th/ 347
METRIC RANK
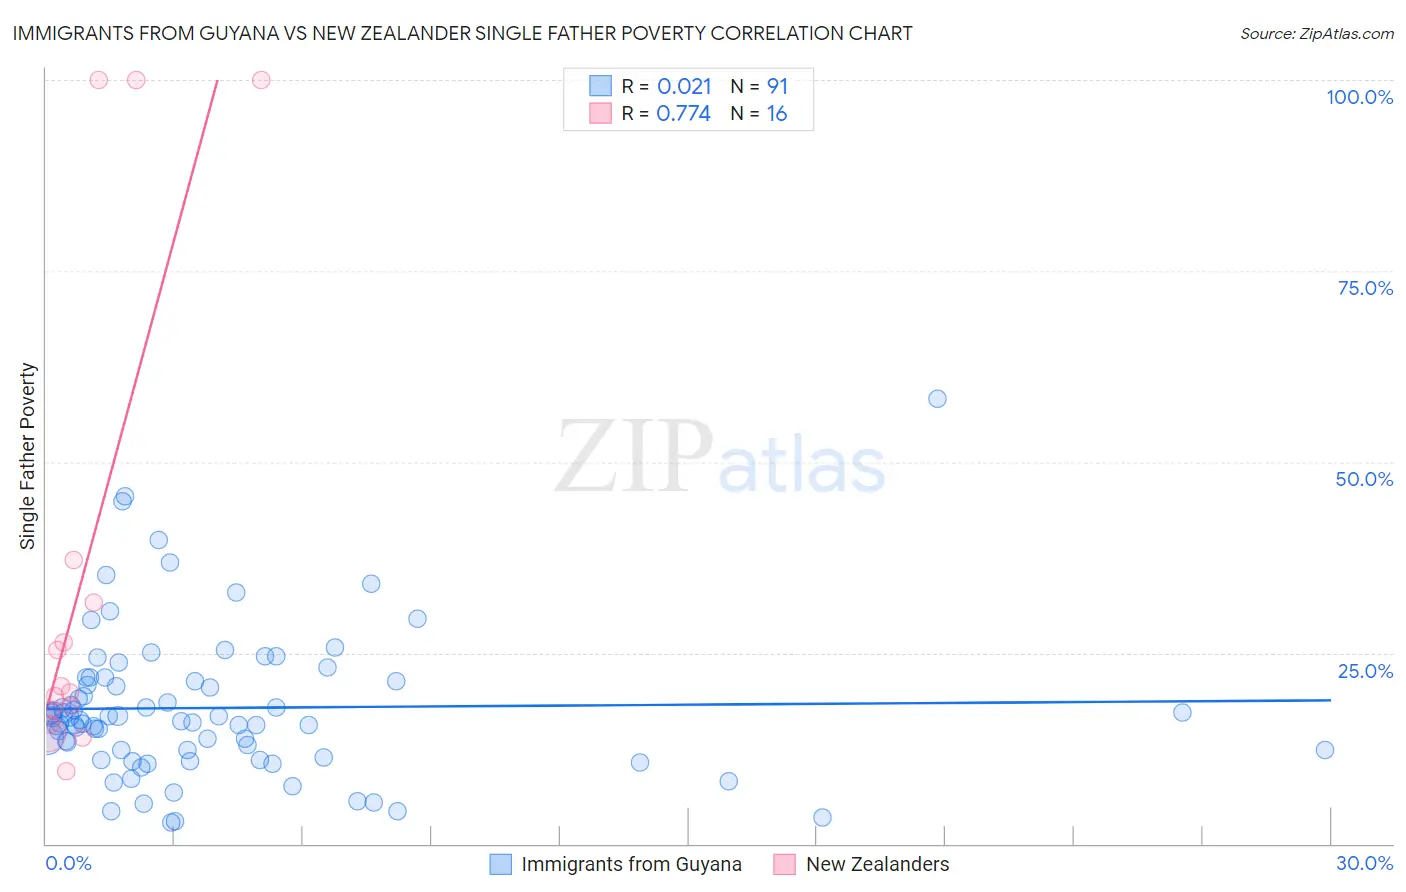
Immigrants from Guyana vs New Zealander Single Father Poverty Correlation Chart
The statistical analysis conducted on geographies consisting of 157,234,374 people shows no correlation between the proportion of Immigrants from Guyana and poverty level among single fathers in the United States with a correlation coefficient (R) of 0.021 and weighted average of 16.5%. Similarly, the statistical analysis conducted on geographies consisting of 95,950,950 people shows a strong positive correlation between the proportion of New Zealanders and poverty level among single fathers in the United States with a correlation coefficient (R) of 0.774 and weighted average of 16.6%, a difference of 0.93%.
Single Father Poverty Correlation Summary
| Measurement | Immigrants from Guyana | New Zealander |
| Minimum | 2.8% | 9.5% |
| Maximum | 58.2% | 100.0% |
| Range | 55.4% | 90.5% |
| Mean | 17.8% | 35.6% |
| Median | 16.3% | 20.2% |
| Interquartile 25% (IQ1) | 12.2% | 16.6% |
| Interquartile 75% (IQ3) | 21.3% | 34.4% |
| Interquartile Range (IQR) | 9.1% | 17.8% |
| Standard Deviation (Sample) | 9.7% | 32.7% |
| Standard Deviation (Population) | 9.6% | 31.7% |
Demographics Similar to Immigrants from Guyana and New Zealanders by Single Father Poverty
In terms of single father poverty, the demographic groups most similar to Immigrants from Guyana are Immigrants from Burma/Myanmar (16.5%, a difference of 0.050%), Latvian (16.5%, a difference of 0.10%), Immigrants from Switzerland (16.5%, a difference of 0.13%), Ecuadorian (16.5%, a difference of 0.15%), and Cape Verdean (16.5%, a difference of 0.16%). Similarly, the demographic groups most similar to New Zealanders are Immigrants from Senegal (16.6%, a difference of 0.0%), Eastern European (16.6%, a difference of 0.0%), European (16.6%, a difference of 0.040%), Venezuelan (16.6%, a difference of 0.050%), and Immigrants from Guatemala (16.6%, a difference of 0.10%).
| Demographics | Rating | Rank | Single Father Poverty |
| Latvians | 28.9 /100 | #189 | Fair 16.5% |
| Immigrants | Burma/Myanmar | 28.0 /100 | #190 | Fair 16.5% |
| Immigrants | Guyana | 27.1 /100 | #191 | Fair 16.5% |
| Immigrants | Switzerland | 24.8 /100 | #192 | Fair 16.5% |
| Ecuadorians | 24.5 /100 | #193 | Fair 16.5% |
| Cape Verdeans | 24.4 /100 | #194 | Fair 16.5% |
| Immigrants | Barbados | 24.3 /100 | #195 | Fair 16.5% |
| Immigrants | Canada | 21.9 /100 | #196 | Fair 16.5% |
| Immigrants | Northern Europe | 20.3 /100 | #197 | Fair 16.5% |
| Romanians | 20.1 /100 | #198 | Fair 16.5% |
| Immigrants | Belize | 19.8 /100 | #199 | Poor 16.5% |
| Syrians | 17.4 /100 | #200 | Poor 16.6% |
| Cubans | 16.5 /100 | #201 | Poor 16.6% |
| Immigrants | Croatia | 16.5 /100 | #202 | Poor 16.6% |
| Immigrants | North America | 15.1 /100 | #203 | Poor 16.6% |
| Immigrants | Guatemala | 14.8 /100 | #204 | Poor 16.6% |
| Venezuelans | 14.3 /100 | #205 | Poor 16.6% |
| Immigrants | Senegal | 13.7 /100 | #206 | Poor 16.6% |
| New Zealanders | 13.7 /100 | #207 | Poor 16.6% |
| Eastern Europeans | 13.7 /100 | #208 | Poor 16.6% |
| Europeans | 13.2 /100 | #209 | Poor 16.6% |