Cambodian vs Immigrants from Ecuador Poverty
COMPARE
Cambodian
Immigrants from Ecuador
Poverty
Poverty Comparison
Cambodians
Immigrants from Ecuador
11.3%
POVERTY
96.7/ 100
METRIC RATING
79th/ 347
METRIC RANK
14.3%
POVERTY
0.1/ 100
METRIC RATING
255th/ 347
METRIC RANK
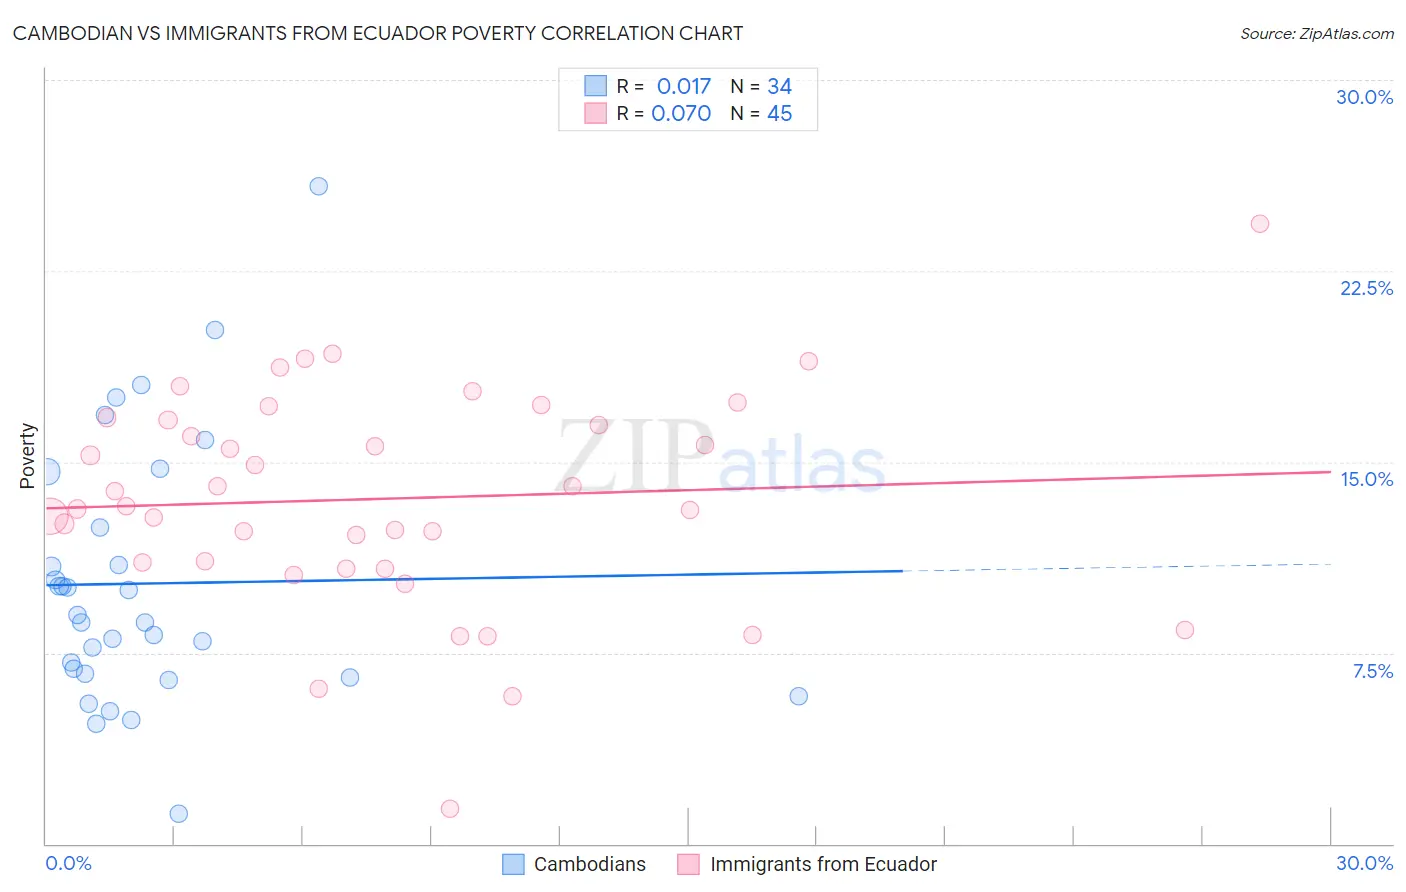
Cambodian vs Immigrants from Ecuador Poverty Correlation Chart
The statistical analysis conducted on geographies consisting of 102,491,880 people shows no correlation between the proportion of Cambodians and poverty level in the United States with a correlation coefficient (R) of 0.017 and weighted average of 11.3%. Similarly, the statistical analysis conducted on geographies consisting of 270,887,290 people shows a slight positive correlation between the proportion of Immigrants from Ecuador and poverty level in the United States with a correlation coefficient (R) of 0.070 and weighted average of 14.3%, a difference of 26.3%.
Poverty Correlation Summary
| Measurement | Cambodian | Immigrants from Ecuador |
| Minimum | 1.2% | 1.4% |
| Maximum | 25.8% | 24.4% |
| Range | 24.6% | 23.0% |
| Mean | 10.2% | 13.6% |
| Median | 8.8% | 13.3% |
| Interquartile 25% (IQ1) | 6.7% | 10.9% |
| Interquartile 75% (IQ3) | 12.4% | 16.7% |
| Interquartile Range (IQR) | 5.7% | 5.8% |
| Standard Deviation (Sample) | 5.1% | 4.3% |
| Standard Deviation (Population) | 5.1% | 4.2% |
Similar Demographics by Poverty
Demographics Similar to Cambodians by Poverty
In terms of poverty, the demographic groups most similar to Cambodians are Indian (Asian) (11.3%, a difference of 0.020%), Irish (11.3%, a difference of 0.020%), Dutch (11.3%, a difference of 0.040%), Immigrants from Eastern Asia (11.3%, a difference of 0.060%), and Egyptian (11.3%, a difference of 0.12%).
| Demographics | Rating | Rank | Poverty |
| Europeans | 97.2 /100 | #72 | Exceptional 11.3% |
| Immigrants | Belgium | 97.2 /100 | #73 | Exceptional 11.3% |
| Carpatho Rusyns | 97.2 /100 | #74 | Exceptional 11.3% |
| Immigrants | Eastern Europe | 97.0 /100 | #75 | Exceptional 11.3% |
| Immigrants | North America | 96.8 /100 | #76 | Exceptional 11.3% |
| Immigrants | Eastern Asia | 96.7 /100 | #77 | Exceptional 11.3% |
| Dutch | 96.7 /100 | #78 | Exceptional 11.3% |
| Cambodians | 96.7 /100 | #79 | Exceptional 11.3% |
| Indians (Asian) | 96.6 /100 | #80 | Exceptional 11.3% |
| Irish | 96.6 /100 | #81 | Exceptional 11.3% |
| Egyptians | 96.5 /100 | #82 | Exceptional 11.3% |
| Immigrants | Sweden | 96.3 /100 | #83 | Exceptional 11.3% |
| English | 96.3 /100 | #84 | Exceptional 11.3% |
| Immigrants | England | 96.2 /100 | #85 | Exceptional 11.4% |
| Jordanians | 96.0 /100 | #86 | Exceptional 11.4% |
Demographics Similar to Immigrants from Ecuador by Poverty
In terms of poverty, the demographic groups most similar to Immigrants from Ecuador are Mexican American Indian (14.3%, a difference of 0.020%), Trinidadian and Tobagonian (14.3%, a difference of 0.060%), Ottawa (14.3%, a difference of 0.070%), Immigrants from El Salvador (14.3%, a difference of 0.10%), and Immigrants from Nicaragua (14.3%, a difference of 0.34%).
| Demographics | Rating | Rank | Poverty |
| Immigrants | Western Africa | 0.2 /100 | #248 | Tragic 14.1% |
| Immigrants | Ghana | 0.2 /100 | #249 | Tragic 14.2% |
| Cree | 0.2 /100 | #250 | Tragic 14.2% |
| Immigrants | Burma/Myanmar | 0.2 /100 | #251 | Tragic 14.2% |
| Spanish American Indians | 0.2 /100 | #252 | Tragic 14.2% |
| Immigrants | Trinidad and Tobago | 0.2 /100 | #253 | Tragic 14.2% |
| Immigrants | El Salvador | 0.1 /100 | #254 | Tragic 14.3% |
| Immigrants | Ecuador | 0.1 /100 | #255 | Tragic 14.3% |
| Mexican American Indians | 0.1 /100 | #256 | Tragic 14.3% |
| Trinidadians and Tobagonians | 0.1 /100 | #257 | Tragic 14.3% |
| Ottawa | 0.1 /100 | #258 | Tragic 14.3% |
| Immigrants | Nicaragua | 0.1 /100 | #259 | Tragic 14.3% |
| Cape Verdeans | 0.1 /100 | #260 | Tragic 14.4% |
| Cherokee | 0.1 /100 | #261 | Tragic 14.4% |
| Immigrants | Liberia | 0.1 /100 | #262 | Tragic 14.4% |