Cambodian vs Colombian Poverty
COMPARE
Cambodian
Colombian
Poverty
Poverty Comparison
Cambodians
Colombians
11.3%
POVERTY
96.7/ 100
METRIC RATING
79th/ 347
METRIC RANK
12.2%
POVERTY
57.8/ 100
METRIC RATING
164th/ 347
METRIC RANK
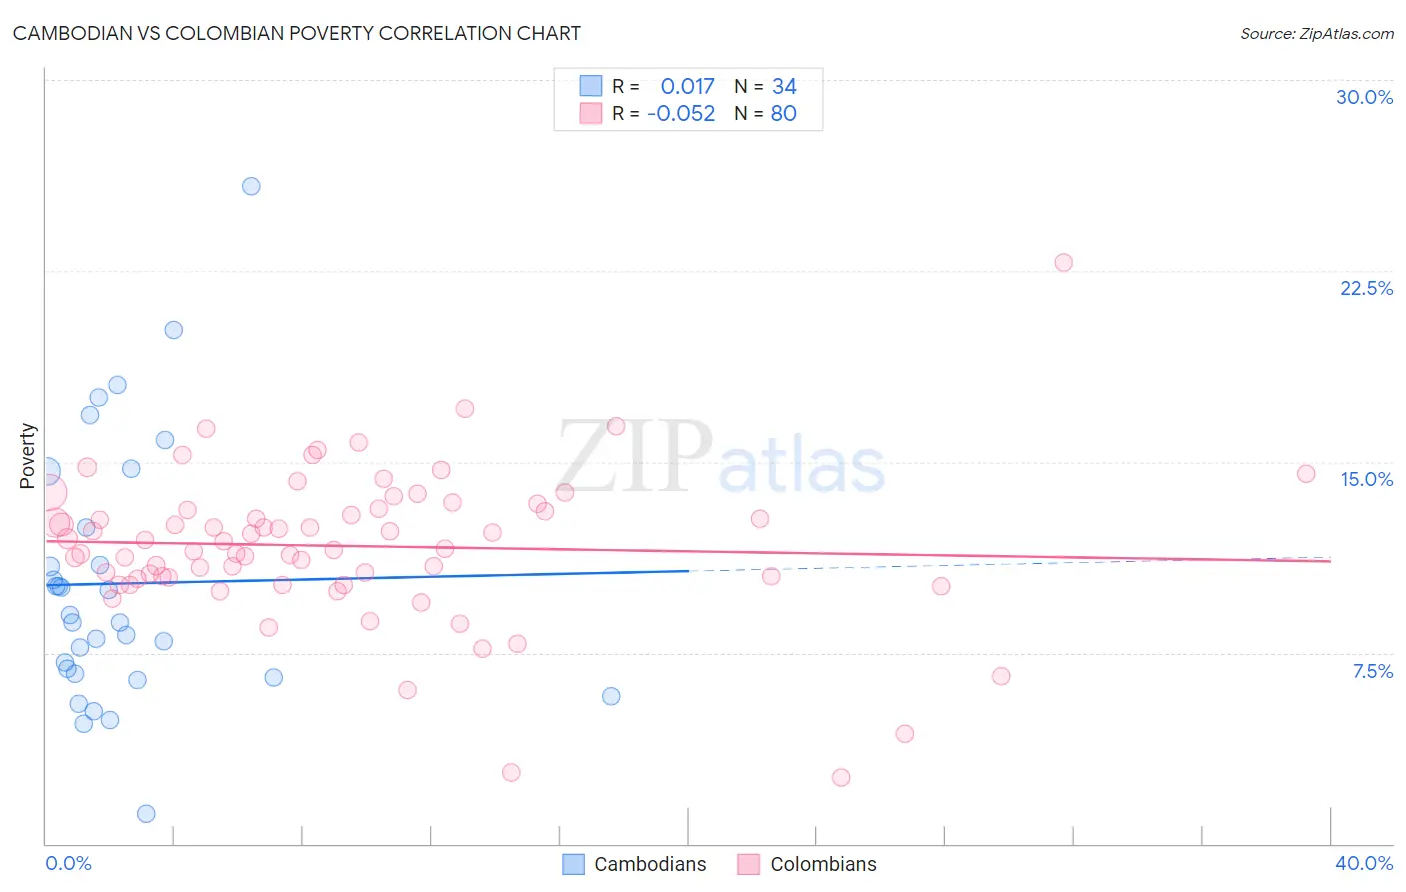
Cambodian vs Colombian Poverty Correlation Chart
The statistical analysis conducted on geographies consisting of 102,491,880 people shows no correlation between the proportion of Cambodians and poverty level in the United States with a correlation coefficient (R) of 0.017 and weighted average of 11.3%. Similarly, the statistical analysis conducted on geographies consisting of 419,330,126 people shows a slight negative correlation between the proportion of Colombians and poverty level in the United States with a correlation coefficient (R) of -0.052 and weighted average of 12.2%, a difference of 8.0%.
Poverty Correlation Summary
| Measurement | Cambodian | Colombian |
| Minimum | 1.2% | 2.6% |
| Maximum | 25.8% | 22.8% |
| Range | 24.6% | 20.2% |
| Mean | 10.2% | 11.7% |
| Median | 8.8% | 11.7% |
| Interquartile 25% (IQ1) | 6.7% | 10.5% |
| Interquartile 75% (IQ3) | 12.4% | 13.1% |
| Interquartile Range (IQR) | 5.7% | 2.7% |
| Standard Deviation (Sample) | 5.1% | 3.0% |
| Standard Deviation (Population) | 5.1% | 3.0% |
Similar Demographics by Poverty
Demographics Similar to Cambodians by Poverty
In terms of poverty, the demographic groups most similar to Cambodians are Indian (Asian) (11.3%, a difference of 0.020%), Irish (11.3%, a difference of 0.020%), Dutch (11.3%, a difference of 0.040%), Immigrants from Eastern Asia (11.3%, a difference of 0.060%), and Egyptian (11.3%, a difference of 0.12%).
| Demographics | Rating | Rank | Poverty |
| Europeans | 97.2 /100 | #72 | Exceptional 11.3% |
| Immigrants | Belgium | 97.2 /100 | #73 | Exceptional 11.3% |
| Carpatho Rusyns | 97.2 /100 | #74 | Exceptional 11.3% |
| Immigrants | Eastern Europe | 97.0 /100 | #75 | Exceptional 11.3% |
| Immigrants | North America | 96.8 /100 | #76 | Exceptional 11.3% |
| Immigrants | Eastern Asia | 96.7 /100 | #77 | Exceptional 11.3% |
| Dutch | 96.7 /100 | #78 | Exceptional 11.3% |
| Cambodians | 96.7 /100 | #79 | Exceptional 11.3% |
| Indians (Asian) | 96.6 /100 | #80 | Exceptional 11.3% |
| Irish | 96.6 /100 | #81 | Exceptional 11.3% |
| Egyptians | 96.5 /100 | #82 | Exceptional 11.3% |
| Immigrants | Sweden | 96.3 /100 | #83 | Exceptional 11.3% |
| English | 96.3 /100 | #84 | Exceptional 11.3% |
| Immigrants | England | 96.2 /100 | #85 | Exceptional 11.4% |
| Jordanians | 96.0 /100 | #86 | Exceptional 11.4% |
Demographics Similar to Colombians by Poverty
In terms of poverty, the demographic groups most similar to Colombians are Immigrants from Albania (12.2%, a difference of 0.010%), Immigrants from Ethiopia (12.2%, a difference of 0.070%), Venezuelan (12.2%, a difference of 0.10%), Immigrants from Chile (12.2%, a difference of 0.11%), and Ethiopian (12.2%, a difference of 0.12%).
| Demographics | Rating | Rank | Poverty |
| Costa Ricans | 62.2 /100 | #157 | Good 12.2% |
| Taiwanese | 61.8 /100 | #158 | Good 12.2% |
| Pennsylvania Germans | 60.8 /100 | #159 | Good 12.2% |
| Immigrants | Nepal | 60.4 /100 | #160 | Good 12.2% |
| Immigrants | Fiji | 59.1 /100 | #161 | Average 12.2% |
| Ethiopians | 59.1 /100 | #162 | Average 12.2% |
| Immigrants | Ethiopia | 58.6 /100 | #163 | Average 12.2% |
| Colombians | 57.8 /100 | #164 | Average 12.2% |
| Immigrants | Albania | 57.7 /100 | #165 | Average 12.2% |
| Venezuelans | 56.9 /100 | #166 | Average 12.2% |
| Immigrants | Chile | 56.7 /100 | #167 | Average 12.2% |
| Immigrants | Venezuela | 56.5 /100 | #168 | Average 12.2% |
| Whites/Caucasians | 55.4 /100 | #169 | Average 12.3% |
| Immigrants | Oceania | 54.6 /100 | #170 | Average 12.3% |
| Immigrants | Spain | 51.3 /100 | #171 | Average 12.3% |