Cambodian vs Immigrants from Indonesia Poverty
COMPARE
Cambodian
Immigrants from Indonesia
Poverty
Poverty Comparison
Cambodians
Immigrants from Indonesia
11.3%
POVERTY
96.7/ 100
METRIC RATING
79th/ 347
METRIC RANK
11.5%
POVERTY
94.2/ 100
METRIC RATING
99th/ 347
METRIC RANK
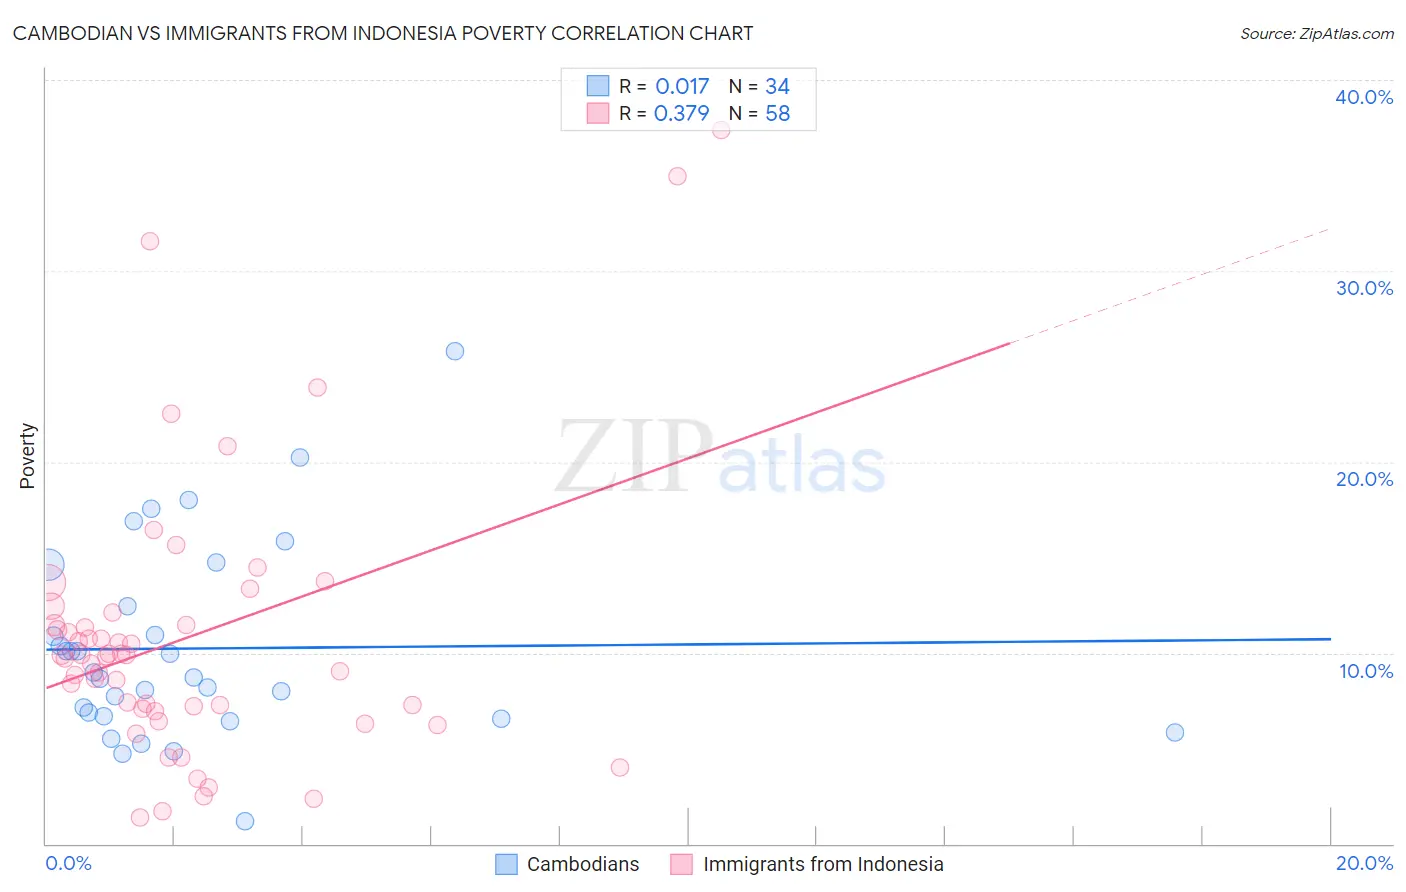
Cambodian vs Immigrants from Indonesia Poverty Correlation Chart
The statistical analysis conducted on geographies consisting of 102,491,880 people shows no correlation between the proportion of Cambodians and poverty level in the United States with a correlation coefficient (R) of 0.017 and weighted average of 11.3%. Similarly, the statistical analysis conducted on geographies consisting of 215,732,170 people shows a mild positive correlation between the proportion of Immigrants from Indonesia and poverty level in the United States with a correlation coefficient (R) of 0.379 and weighted average of 11.5%, a difference of 1.5%.
Poverty Correlation Summary
| Measurement | Cambodian | Immigrants from Indonesia |
| Minimum | 1.2% | 1.4% |
| Maximum | 25.8% | 37.3% |
| Range | 24.6% | 36.0% |
| Mean | 10.2% | 10.8% |
| Median | 8.8% | 9.8% |
| Interquartile 25% (IQ1) | 6.7% | 7.1% |
| Interquartile 75% (IQ3) | 12.4% | 11.5% |
| Interquartile Range (IQR) | 5.7% | 4.4% |
| Standard Deviation (Sample) | 5.1% | 7.2% |
| Standard Deviation (Population) | 5.1% | 7.2% |
Demographics Similar to Cambodians and Immigrants from Indonesia by Poverty
In terms of poverty, the demographic groups most similar to Cambodians are Indian (Asian) (11.3%, a difference of 0.020%), Irish (11.3%, a difference of 0.020%), Egyptian (11.3%, a difference of 0.12%), Immigrants from Sweden (11.3%, a difference of 0.29%), and English (11.3%, a difference of 0.30%). Similarly, the demographic groups most similar to Immigrants from Indonesia are Immigrants from Latvia (11.5%, a difference of 0.14%), Immigrants from Egypt (11.5%, a difference of 0.17%), Immigrants from South Africa (11.5%, a difference of 0.20%), Australian (11.4%, a difference of 0.32%), and Paraguayan (11.4%, a difference of 0.33%).
| Demographics | Rating | Rank | Poverty |
| Cambodians | 96.7 /100 | #79 | Exceptional 11.3% |
| Indians (Asian) | 96.6 /100 | #80 | Exceptional 11.3% |
| Irish | 96.6 /100 | #81 | Exceptional 11.3% |
| Egyptians | 96.5 /100 | #82 | Exceptional 11.3% |
| Immigrants | Sweden | 96.3 /100 | #83 | Exceptional 11.3% |
| English | 96.3 /100 | #84 | Exceptional 11.3% |
| Immigrants | England | 96.2 /100 | #85 | Exceptional 11.4% |
| Jordanians | 96.0 /100 | #86 | Exceptional 11.4% |
| Northern Europeans | 96.0 /100 | #87 | Exceptional 11.4% |
| Belgians | 95.8 /100 | #88 | Exceptional 11.4% |
| Czechoslovakians | 95.7 /100 | #89 | Exceptional 11.4% |
| Immigrants | Denmark | 95.5 /100 | #90 | Exceptional 11.4% |
| Finns | 95.2 /100 | #91 | Exceptional 11.4% |
| British | 95.0 /100 | #92 | Exceptional 11.4% |
| Romanians | 94.9 /100 | #93 | Exceptional 11.4% |
| Paraguayans | 94.9 /100 | #94 | Exceptional 11.4% |
| Australians | 94.9 /100 | #95 | Exceptional 11.4% |
| Immigrants | South Africa | 94.7 /100 | #96 | Exceptional 11.5% |
| Immigrants | Egypt | 94.6 /100 | #97 | Exceptional 11.5% |
| Immigrants | Latvia | 94.5 /100 | #98 | Exceptional 11.5% |
| Immigrants | Indonesia | 94.2 /100 | #99 | Exceptional 11.5% |