Cambodian vs Alaska Native Child Poverty Among Boys Under 16
COMPARE
Cambodian
Alaska Native
Child Poverty Among Boys Under 16
Child Poverty Among Boys Under 16 Comparison
Cambodians
Alaska Natives
14.5%
CHILD POVERTY AMONG BOYS UNDER 16
98.5/ 100
METRIC RATING
63rd/ 347
METRIC RANK
16.8%
CHILD POVERTY AMONG BOYS UNDER 16
29.8/ 100
METRIC RATING
191st/ 347
METRIC RANK
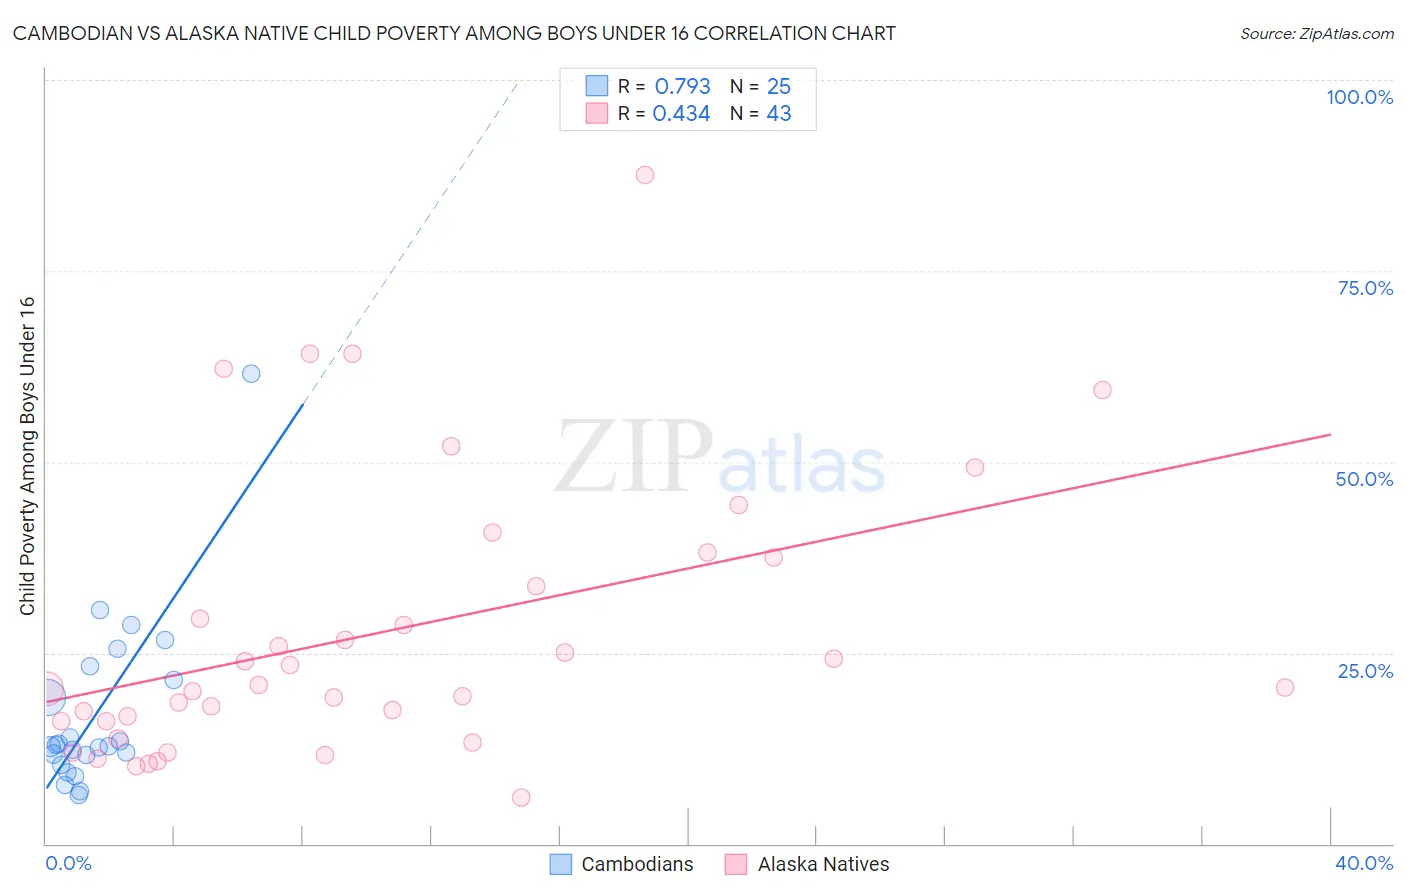
Cambodian vs Alaska Native Child Poverty Among Boys Under 16 Correlation Chart
The statistical analysis conducted on geographies consisting of 102,113,836 people shows a strong positive correlation between the proportion of Cambodians and poverty level among boys under the age of 16 in the United States with a correlation coefficient (R) of 0.793 and weighted average of 14.5%. Similarly, the statistical analysis conducted on geographies consisting of 76,419,189 people shows a moderate positive correlation between the proportion of Alaska Natives and poverty level among boys under the age of 16 in the United States with a correlation coefficient (R) of 0.434 and weighted average of 16.8%, a difference of 16.0%.
Child Poverty Among Boys Under 16 Correlation Summary
| Measurement | Cambodian | Alaska Native |
| Minimum | 6.4% | 6.1% |
| Maximum | 61.5% | 87.5% |
| Range | 55.1% | 81.4% |
| Mean | 17.0% | 27.7% |
| Median | 12.7% | 20.4% |
| Interquartile 25% (IQ1) | 10.9% | 16.0% |
| Interquartile 75% (IQ3) | 22.4% | 37.5% |
| Interquartile Range (IQR) | 11.4% | 21.5% |
| Standard Deviation (Sample) | 11.6% | 18.4% |
| Standard Deviation (Population) | 11.4% | 18.1% |
Similar Demographics by Child Poverty Among Boys Under 16
Demographics Similar to Cambodians by Child Poverty Among Boys Under 16
In terms of child poverty among boys under 16, the demographic groups most similar to Cambodians are Immigrants from Romania (14.5%, a difference of 0.13%), Soviet Union (14.5%, a difference of 0.16%), Immigrants from Bulgaria (14.5%, a difference of 0.17%), Immigrants from Europe (14.5%, a difference of 0.19%), and Slovene (14.5%, a difference of 0.28%).
| Demographics | Rating | Rank | Child Poverty Among Boys Under 16 |
| Zimbabweans | 99.0 /100 | #56 | Exceptional 14.3% |
| Poles | 98.9 /100 | #57 | Exceptional 14.4% |
| Immigrants | Sweden | 98.9 /100 | #58 | Exceptional 14.4% |
| Immigrants | Czechoslovakia | 98.9 /100 | #59 | Exceptional 14.4% |
| Immigrants | Belgium | 98.9 /100 | #60 | Exceptional 14.4% |
| Scandinavians | 98.8 /100 | #61 | Exceptional 14.4% |
| Immigrants | Israel | 98.7 /100 | #62 | Exceptional 14.4% |
| Cambodians | 98.5 /100 | #63 | Exceptional 14.5% |
| Immigrants | Romania | 98.5 /100 | #64 | Exceptional 14.5% |
| Soviet Union | 98.5 /100 | #65 | Exceptional 14.5% |
| Immigrants | Bulgaria | 98.5 /100 | #66 | Exceptional 14.5% |
| Immigrants | Europe | 98.4 /100 | #67 | Exceptional 14.5% |
| Slovenes | 98.4 /100 | #68 | Exceptional 14.5% |
| Immigrants | Austria | 98.4 /100 | #69 | Exceptional 14.5% |
| Europeans | 98.4 /100 | #70 | Exceptional 14.5% |
Demographics Similar to Alaska Natives by Child Poverty Among Boys Under 16
In terms of child poverty among boys under 16, the demographic groups most similar to Alaska Natives are Arab (16.8%, a difference of 0.17%), Immigrants from Morocco (16.7%, a difference of 0.59%), Immigrants from South America (16.7%, a difference of 0.98%), Immigrants from Costa Rica (16.7%, a difference of 0.99%), and Hmong (16.6%, a difference of 1.1%).
| Demographics | Rating | Rank | Child Poverty Among Boys Under 16 |
| Celtics | 40.6 /100 | #184 | Average 16.6% |
| Immigrants | Western Asia | 40.4 /100 | #185 | Average 16.6% |
| Hmong | 38.4 /100 | #186 | Fair 16.6% |
| Immigrants | Costa Rica | 37.8 /100 | #187 | Fair 16.7% |
| Immigrants | South America | 37.7 /100 | #188 | Fair 16.7% |
| Immigrants | Morocco | 34.5 /100 | #189 | Fair 16.7% |
| Arabs | 31.1 /100 | #190 | Fair 16.8% |
| Alaska Natives | 29.8 /100 | #191 | Fair 16.8% |
| Immigrants | Uganda | 21.6 /100 | #192 | Fair 17.0% |
| Immigrants | Iraq | 21.6 /100 | #193 | Fair 17.0% |
| Immigrants | Lebanon | 21.2 /100 | #194 | Fair 17.0% |
| Spanish | 20.8 /100 | #195 | Fair 17.0% |
| Spaniards | 20.5 /100 | #196 | Fair 17.1% |
| Immigrants | Kenya | 20.1 /100 | #197 | Fair 17.1% |
| Immigrants | Cameroon | 19.0 /100 | #198 | Poor 17.1% |