Cajun vs English Female Poverty
COMPARE
Cajun
English
Female Poverty
Female Poverty Comparison
Cajuns
English
17.5%
FEMALE POVERTY
0.0/ 100
METRIC RATING
319th/ 347
METRIC RANK
12.4%
FEMALE POVERTY
96.1/ 100
METRIC RATING
89th/ 347
METRIC RANK
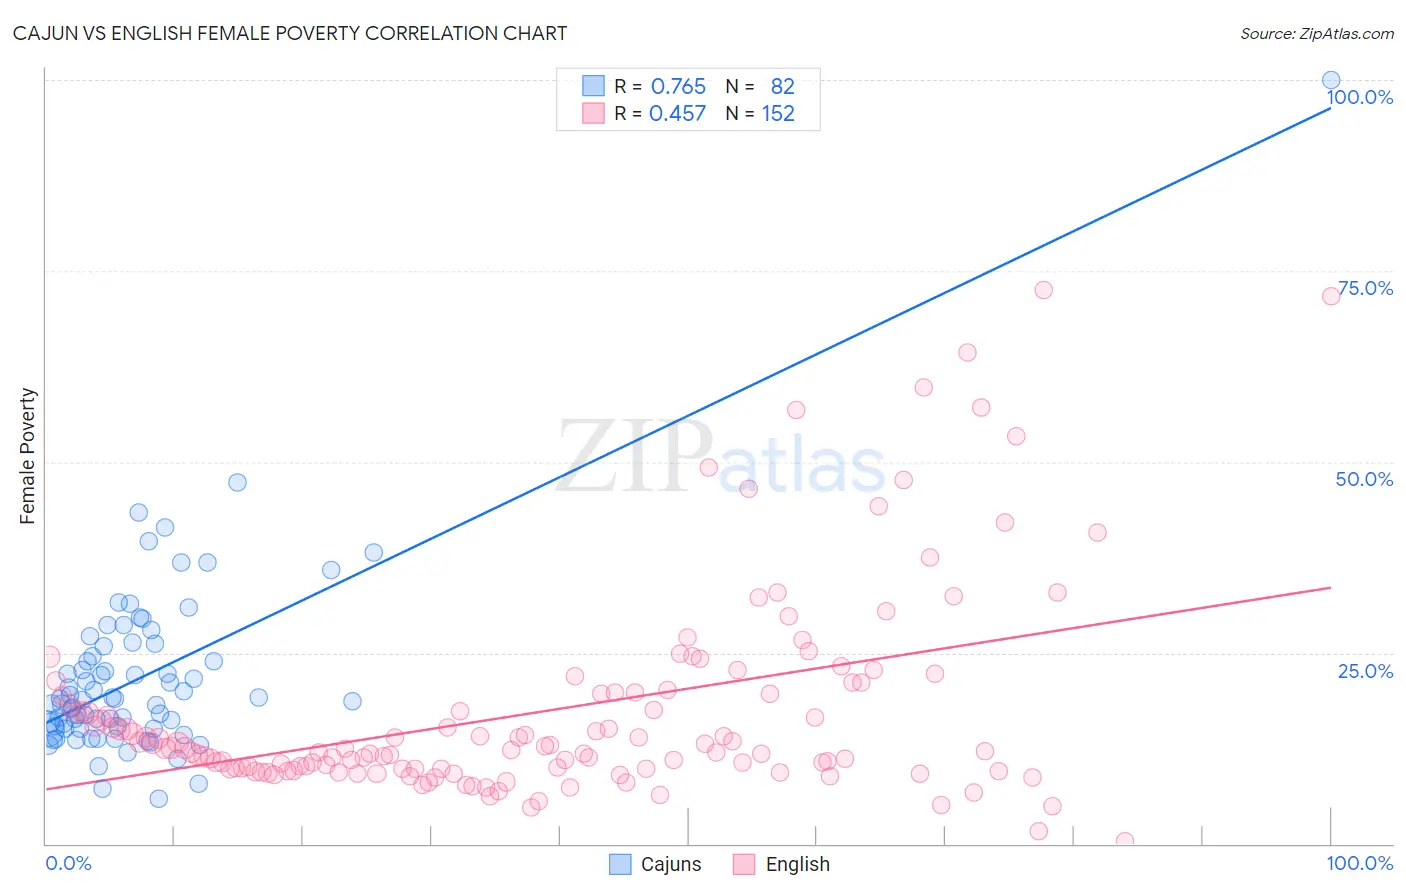
Cajun vs English Female Poverty Correlation Chart
The statistical analysis conducted on geographies consisting of 149,687,613 people shows a strong positive correlation between the proportion of Cajuns and poverty level among females in the United States with a correlation coefficient (R) of 0.765 and weighted average of 17.5%. Similarly, the statistical analysis conducted on geographies consisting of 578,145,061 people shows a moderate positive correlation between the proportion of English and poverty level among females in the United States with a correlation coefficient (R) of 0.457 and weighted average of 12.4%, a difference of 40.7%.
Female Poverty Correlation Summary
| Measurement | Cajun | English |
| Minimum | 5.9% | 0.38% |
| Maximum | 100.0% | 72.5% |
| Range | 94.1% | 72.2% |
| Mean | 21.9% | 17.3% |
| Median | 18.9% | 12.4% |
| Interquartile 25% (IQ1) | 15.1% | 9.8% |
| Interquartile 75% (IQ3) | 25.9% | 19.7% |
| Interquartile Range (IQR) | 10.8% | 9.9% |
| Standard Deviation (Sample) | 12.1% | 13.4% |
| Standard Deviation (Population) | 12.1% | 13.3% |
Similar Demographics by Female Poverty
Demographics Similar to Cajuns by Female Poverty
In terms of female poverty, the demographic groups most similar to Cajuns are Ute (17.5%, a difference of 0.010%), Immigrants from Dominica (17.5%, a difference of 0.080%), Arapaho (17.5%, a difference of 0.15%), Immigrants from Congo (17.4%, a difference of 0.34%), and Honduran (17.4%, a difference of 0.53%).
| Demographics | Rating | Rank | Female Poverty |
| Immigrants | Somalia | 0.0 /100 | #312 | Tragic 17.0% |
| British West Indians | 0.0 /100 | #313 | Tragic 17.0% |
| Dutch West Indians | 0.0 /100 | #314 | Tragic 17.1% |
| U.S. Virgin Islanders | 0.0 /100 | #315 | Tragic 17.3% |
| Hondurans | 0.0 /100 | #316 | Tragic 17.4% |
| Immigrants | Congo | 0.0 /100 | #317 | Tragic 17.4% |
| Ute | 0.0 /100 | #318 | Tragic 17.5% |
| Cajuns | 0.0 /100 | #319 | Tragic 17.5% |
| Immigrants | Dominica | 0.0 /100 | #320 | Tragic 17.5% |
| Arapaho | 0.0 /100 | #321 | Tragic 17.5% |
| Menominee | 0.0 /100 | #322 | Tragic 17.6% |
| Paiute | 0.0 /100 | #323 | Tragic 17.7% |
| Immigrants | Honduras | 0.0 /100 | #324 | Tragic 17.7% |
| Colville | 0.0 /100 | #325 | Tragic 17.8% |
| Central American Indians | 0.0 /100 | #326 | Tragic 18.0% |
Demographics Similar to English by Female Poverty
In terms of female poverty, the demographic groups most similar to English are Finnish (12.4%, a difference of 0.20%), Immigrants from Denmark (12.4%, a difference of 0.22%), Belgian (12.4%, a difference of 0.23%), Okinawan (12.4%, a difference of 0.24%), and Czechoslovakian (12.4%, a difference of 0.24%).
| Demographics | Rating | Rank | Female Poverty |
| Jordanians | 97.1 /100 | #82 | Exceptional 12.3% |
| Immigrants | England | 96.9 /100 | #83 | Exceptional 12.3% |
| Northern Europeans | 96.6 /100 | #84 | Exceptional 12.4% |
| Irish | 96.5 /100 | #85 | Exceptional 12.4% |
| Dutch | 96.5 /100 | #86 | Exceptional 12.4% |
| Okinawans | 96.4 /100 | #87 | Exceptional 12.4% |
| Finns | 96.4 /100 | #88 | Exceptional 12.4% |
| English | 96.1 /100 | #89 | Exceptional 12.4% |
| Immigrants | Denmark | 95.8 /100 | #90 | Exceptional 12.4% |
| Belgians | 95.8 /100 | #91 | Exceptional 12.4% |
| Czechoslovakians | 95.7 /100 | #92 | Exceptional 12.4% |
| Immigrants | Egypt | 95.5 /100 | #93 | Exceptional 12.5% |
| Immigrants | Indonesia | 95.4 /100 | #94 | Exceptional 12.5% |
| Immigrants | South Africa | 95.4 /100 | #95 | Exceptional 12.5% |
| British | 95.2 /100 | #96 | Exceptional 12.5% |