Immigrants from Israel vs English Female Poverty
COMPARE
Immigrants from Israel
English
Female Poverty
Female Poverty Comparison
Immigrants from Israel
English
12.6%
FEMALE POVERTY
92.0/ 100
METRIC RATING
112th/ 347
METRIC RANK
12.4%
FEMALE POVERTY
96.1/ 100
METRIC RATING
89th/ 347
METRIC RANK
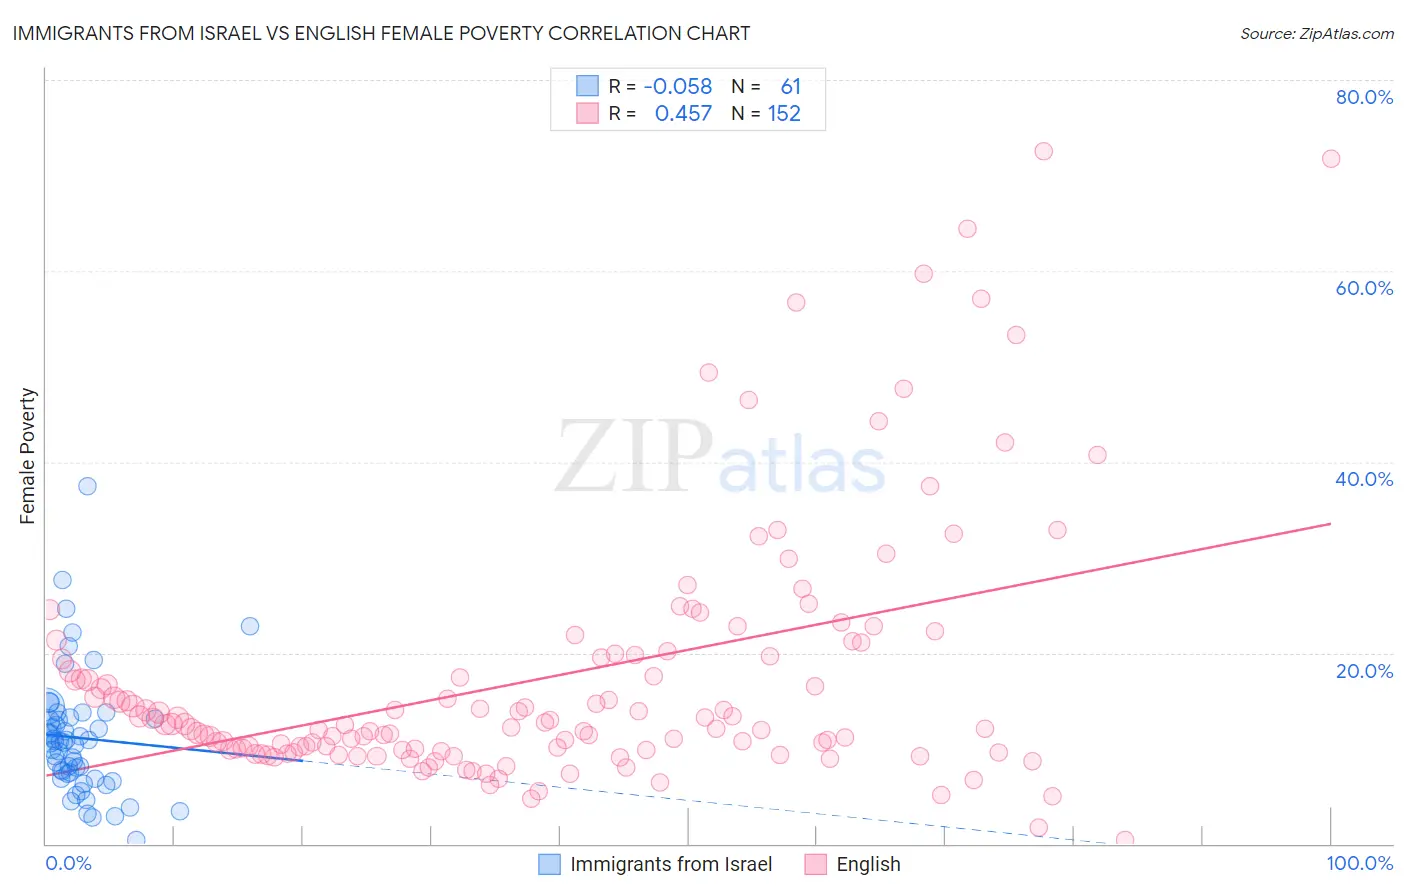
Immigrants from Israel vs English Female Poverty Correlation Chart
The statistical analysis conducted on geographies consisting of 209,961,688 people shows a slight negative correlation between the proportion of Immigrants from Israel and poverty level among females in the United States with a correlation coefficient (R) of -0.058 and weighted average of 12.6%. Similarly, the statistical analysis conducted on geographies consisting of 578,145,061 people shows a moderate positive correlation between the proportion of English and poverty level among females in the United States with a correlation coefficient (R) of 0.457 and weighted average of 12.4%, a difference of 2.0%.
Female Poverty Correlation Summary
| Measurement | Immigrants from Israel | English |
| Minimum | 0.44% | 0.38% |
| Maximum | 37.4% | 72.5% |
| Range | 37.0% | 72.2% |
| Mean | 11.1% | 17.3% |
| Median | 10.6% | 12.4% |
| Interquartile 25% (IQ1) | 7.1% | 9.8% |
| Interquartile 75% (IQ3) | 13.2% | 19.7% |
| Interquartile Range (IQR) | 6.1% | 9.9% |
| Standard Deviation (Sample) | 6.4% | 13.4% |
| Standard Deviation (Population) | 6.4% | 13.3% |
Similar Demographics by Female Poverty
Demographics Similar to Immigrants from Israel by Female Poverty
In terms of female poverty, the demographic groups most similar to Immigrants from Israel are Canadian (12.7%, a difference of 0.030%), Soviet Union (12.6%, a difference of 0.14%), Welsh (12.7%, a difference of 0.15%), Puget Sound Salish (12.7%, a difference of 0.17%), and Immigrants from Russia (12.7%, a difference of 0.29%).
| Demographics | Rating | Rank | Female Poverty |
| Scottish | 94.1 /100 | #105 | Exceptional 12.5% |
| Immigrants | Turkey | 93.8 /100 | #106 | Exceptional 12.6% |
| Laotians | 93.4 /100 | #107 | Exceptional 12.6% |
| Portuguese | 93.1 /100 | #108 | Exceptional 12.6% |
| Immigrants | Zimbabwe | 93.1 /100 | #109 | Exceptional 12.6% |
| Paraguayans | 93.0 /100 | #110 | Exceptional 12.6% |
| Soviet Union | 92.4 /100 | #111 | Exceptional 12.6% |
| Immigrants | Israel | 92.0 /100 | #112 | Exceptional 12.6% |
| Canadians | 92.0 /100 | #113 | Exceptional 12.7% |
| Welsh | 91.6 /100 | #114 | Exceptional 12.7% |
| Puget Sound Salish | 91.5 /100 | #115 | Exceptional 12.7% |
| Immigrants | Russia | 91.2 /100 | #116 | Exceptional 12.7% |
| Immigrants | Southern Europe | 90.9 /100 | #117 | Exceptional 12.7% |
| Sri Lankans | 90.9 /100 | #118 | Exceptional 12.7% |
| Albanians | 90.8 /100 | #119 | Exceptional 12.7% |
Demographics Similar to English by Female Poverty
In terms of female poverty, the demographic groups most similar to English are Finnish (12.4%, a difference of 0.20%), Immigrants from Denmark (12.4%, a difference of 0.22%), Belgian (12.4%, a difference of 0.23%), Okinawan (12.4%, a difference of 0.24%), and Czechoslovakian (12.4%, a difference of 0.24%).
| Demographics | Rating | Rank | Female Poverty |
| Jordanians | 97.1 /100 | #82 | Exceptional 12.3% |
| Immigrants | England | 96.9 /100 | #83 | Exceptional 12.3% |
| Northern Europeans | 96.6 /100 | #84 | Exceptional 12.4% |
| Irish | 96.5 /100 | #85 | Exceptional 12.4% |
| Dutch | 96.5 /100 | #86 | Exceptional 12.4% |
| Okinawans | 96.4 /100 | #87 | Exceptional 12.4% |
| Finns | 96.4 /100 | #88 | Exceptional 12.4% |
| English | 96.1 /100 | #89 | Exceptional 12.4% |
| Immigrants | Denmark | 95.8 /100 | #90 | Exceptional 12.4% |
| Belgians | 95.8 /100 | #91 | Exceptional 12.4% |
| Czechoslovakians | 95.7 /100 | #92 | Exceptional 12.4% |
| Immigrants | Egypt | 95.5 /100 | #93 | Exceptional 12.5% |
| Immigrants | Indonesia | 95.4 /100 | #94 | Exceptional 12.5% |
| Immigrants | South Africa | 95.4 /100 | #95 | Exceptional 12.5% |
| British | 95.2 /100 | #96 | Exceptional 12.5% |