Burmese vs Ugandan Single Father Households
COMPARE
Burmese
Ugandan
Single Father Households
Single Father Households Comparison
Burmese
Ugandans
2.0%
SINGLE FATHER HOUSEHOLDS
99.9/ 100
METRIC RATING
57th/ 347
METRIC RANK
2.3%
SINGLE FATHER HOUSEHOLDS
62.2/ 100
METRIC RATING
170th/ 347
METRIC RANK
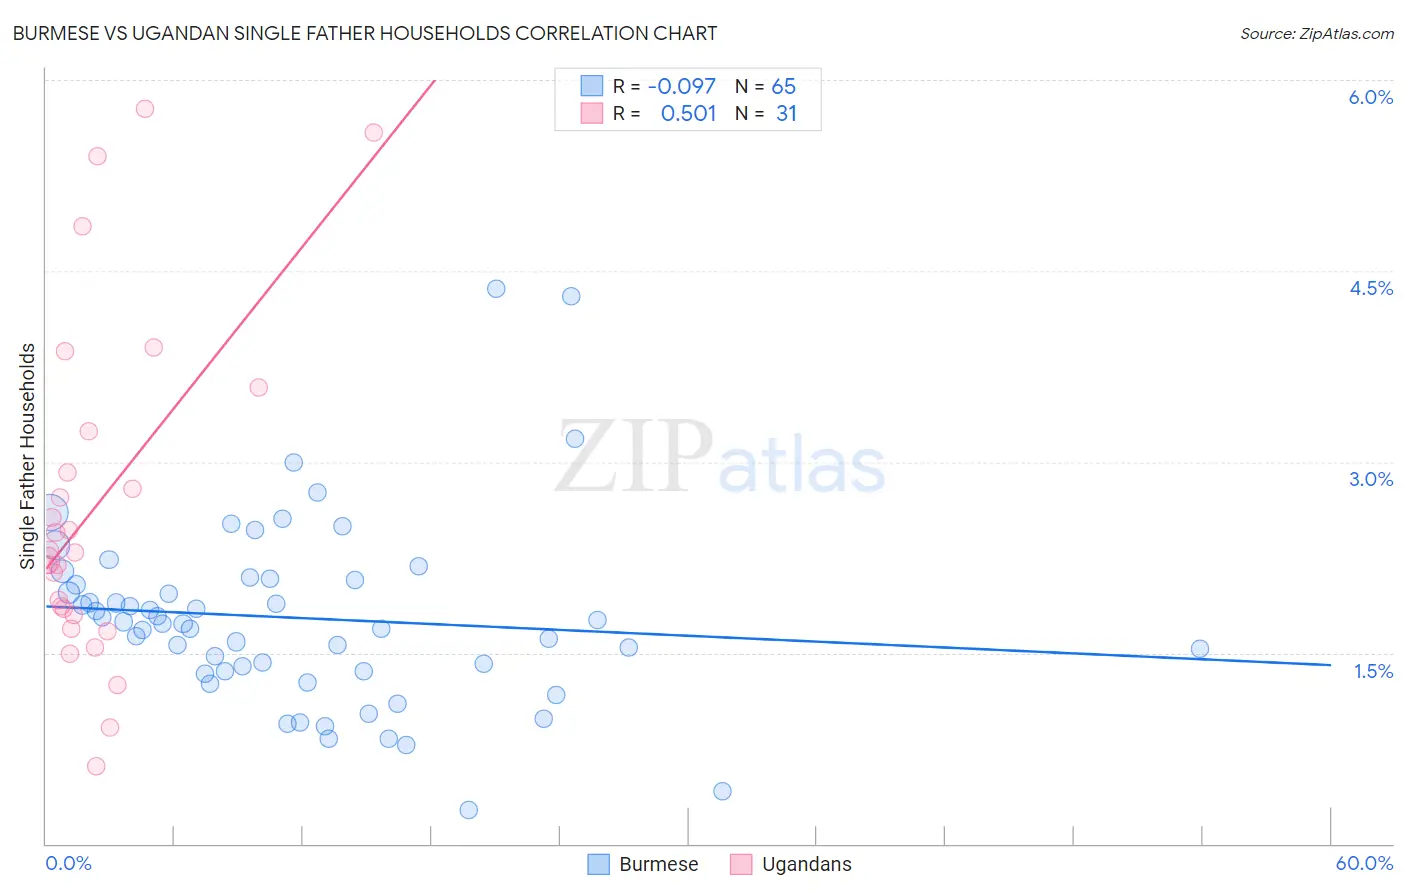
Burmese vs Ugandan Single Father Households Correlation Chart
The statistical analysis conducted on geographies consisting of 460,084,605 people shows a slight negative correlation between the proportion of Burmese and percentage of single father households in the United States with a correlation coefficient (R) of -0.097 and weighted average of 2.0%. Similarly, the statistical analysis conducted on geographies consisting of 93,834,294 people shows a substantial positive correlation between the proportion of Ugandans and percentage of single father households in the United States with a correlation coefficient (R) of 0.501 and weighted average of 2.3%, a difference of 13.9%.
Single Father Households Correlation Summary
| Measurement | Burmese | Ugandan |
| Minimum | 0.27% | 0.61% |
| Maximum | 4.4% | 5.8% |
| Range | 4.1% | 5.2% |
| Mean | 1.8% | 2.6% |
| Median | 1.7% | 2.3% |
| Interquartile 25% (IQ1) | 1.4% | 1.8% |
| Interquartile 75% (IQ3) | 2.1% | 3.2% |
| Interquartile Range (IQR) | 0.72% | 1.4% |
| Standard Deviation (Sample) | 0.74% | 1.3% |
| Standard Deviation (Population) | 0.73% | 1.3% |
Similar Demographics by Single Father Households
Demographics Similar to Burmese by Single Father Households
In terms of single father households, the demographic groups most similar to Burmese are Immigrants from Czechoslovakia (2.0%, a difference of 0.020%), Immigrants from North Macedonia (2.0%, a difference of 0.13%), Immigrants from Austria (2.0%, a difference of 0.14%), Immigrants from Norway (2.0%, a difference of 0.26%), and Immigrants from France (2.0%, a difference of 0.29%).
| Demographics | Rating | Rank | Single Father Households |
| Immigrants | Switzerland | 99.9 /100 | #50 | Exceptional 2.0% |
| Immigrants | Poland | 99.9 /100 | #51 | Exceptional 2.0% |
| Immigrants | Europe | 99.9 /100 | #52 | Exceptional 2.0% |
| Immigrants | Northern Europe | 99.9 /100 | #53 | Exceptional 2.0% |
| Immigrants | Korea | 99.9 /100 | #54 | Exceptional 2.0% |
| Immigrants | France | 99.9 /100 | #55 | Exceptional 2.0% |
| Immigrants | Norway | 99.9 /100 | #56 | Exceptional 2.0% |
| Burmese | 99.9 /100 | #57 | Exceptional 2.0% |
| Immigrants | Czechoslovakia | 99.9 /100 | #58 | Exceptional 2.0% |
| Immigrants | North Macedonia | 99.9 /100 | #59 | Exceptional 2.0% |
| Immigrants | Austria | 99.9 /100 | #60 | Exceptional 2.0% |
| Vietnamese | 99.9 /100 | #61 | Exceptional 2.0% |
| Immigrants | Malaysia | 99.9 /100 | #62 | Exceptional 2.0% |
| Maltese | 99.9 /100 | #63 | Exceptional 2.0% |
| Mongolians | 99.9 /100 | #64 | Exceptional 2.1% |
Demographics Similar to Ugandans by Single Father Households
In terms of single father households, the demographic groups most similar to Ugandans are Czech (2.3%, a difference of 0.020%), Swedish (2.3%, a difference of 0.050%), Icelander (2.3%, a difference of 0.070%), South American (2.3%, a difference of 0.16%), and Czechoslovakian (2.3%, a difference of 0.26%).
| Demographics | Rating | Rank | Single Father Households |
| Irish | 72.1 /100 | #163 | Good 2.3% |
| Pakistanis | 70.6 /100 | #164 | Good 2.3% |
| Scotch-Irish | 69.4 /100 | #165 | Good 2.3% |
| English | 68.6 /100 | #166 | Good 2.3% |
| South Americans | 64.3 /100 | #167 | Good 2.3% |
| Icelanders | 63.1 /100 | #168 | Good 2.3% |
| Czechs | 62.5 /100 | #169 | Good 2.3% |
| Ugandans | 62.2 /100 | #170 | Good 2.3% |
| Swedes | 61.6 /100 | #171 | Good 2.3% |
| Czechoslovakians | 58.9 /100 | #172 | Average 2.3% |
| Celtics | 55.4 /100 | #173 | Average 2.3% |
| Afghans | 50.0 /100 | #174 | Average 2.3% |
| Immigrants | Jamaica | 49.1 /100 | #175 | Average 2.3% |
| Danes | 48.2 /100 | #176 | Average 2.3% |
| Colombians | 48.0 /100 | #177 | Average 2.3% |