Burmese vs Swiss Single Father Poverty
COMPARE
Burmese
Swiss
Single Father Poverty
Single Father Poverty Comparison
Burmese
Swiss
15.5%
SINGLE FATHER POVERTY
99.0/ 100
METRIC RATING
88th/ 347
METRIC RANK
17.3%
SINGLE FATHER POVERTY
0.5/ 100
METRIC RATING
261st/ 347
METRIC RANK
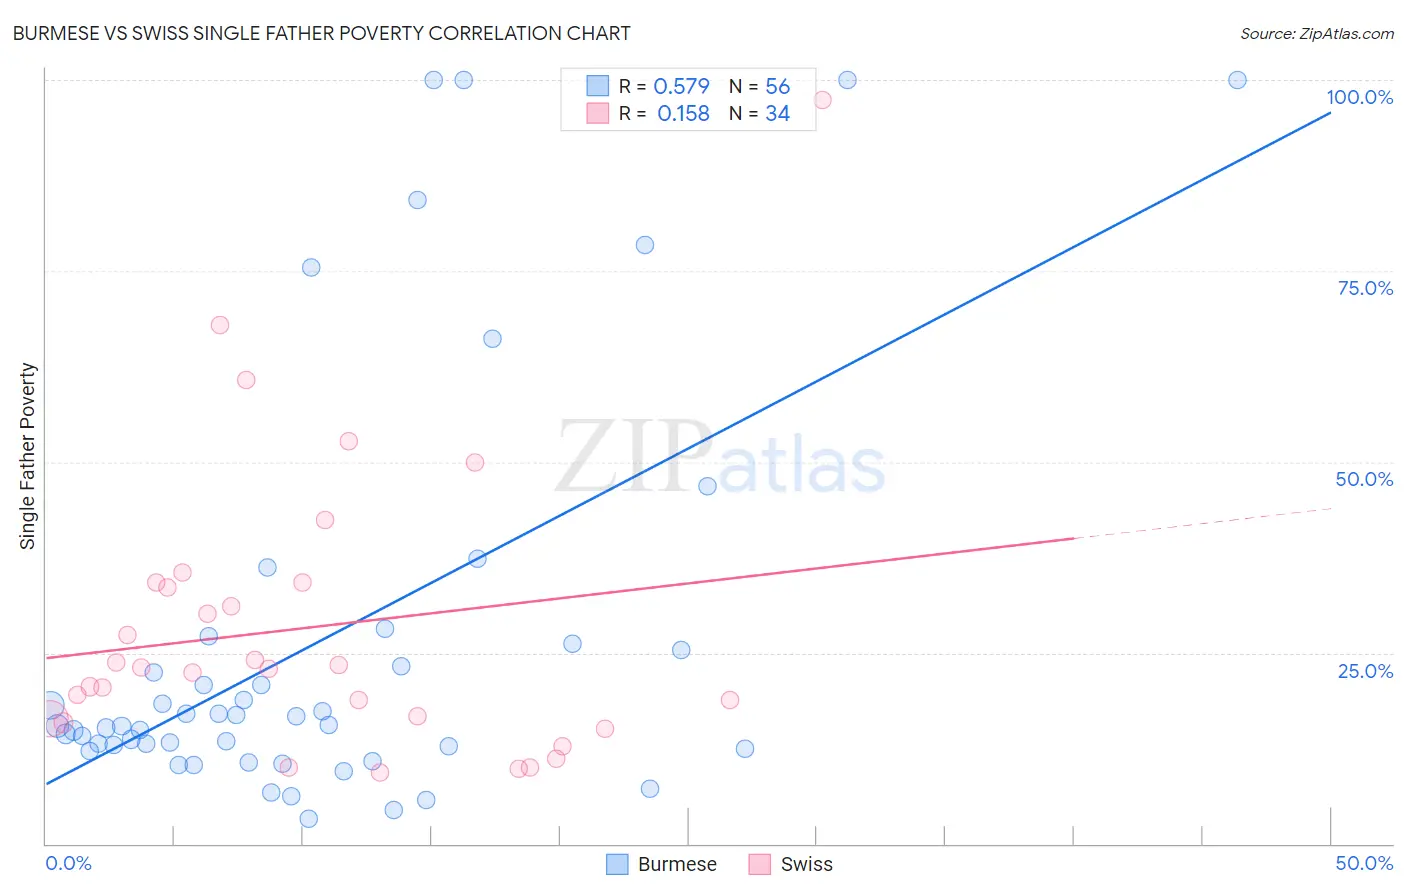
Burmese vs Swiss Single Father Poverty Correlation Chart
The statistical analysis conducted on geographies consisting of 355,001,827 people shows a substantial positive correlation between the proportion of Burmese and poverty level among single fathers in the United States with a correlation coefficient (R) of 0.579 and weighted average of 15.5%. Similarly, the statistical analysis conducted on geographies consisting of 347,944,226 people shows a poor positive correlation between the proportion of Swiss and poverty level among single fathers in the United States with a correlation coefficient (R) of 0.158 and weighted average of 17.3%, a difference of 11.6%.
Single Father Poverty Correlation Summary
| Measurement | Burmese | Swiss |
| Minimum | 3.2% | 9.4% |
| Maximum | 100.0% | 97.4% |
| Range | 96.8% | 88.1% |
| Mean | 26.6% | 28.3% |
| Median | 15.4% | 23.0% |
| Interquartile 25% (IQ1) | 12.7% | 16.3% |
| Interquartile 75% (IQ3) | 25.9% | 34.2% |
| Interquartile Range (IQR) | 13.2% | 17.9% |
| Standard Deviation (Sample) | 26.9% | 19.0% |
| Standard Deviation (Population) | 26.7% | 18.7% |
Similar Demographics by Single Father Poverty
Demographics Similar to Burmese by Single Father Poverty
In terms of single father poverty, the demographic groups most similar to Burmese are Brazilian (15.5%, a difference of 0.030%), Immigrants from Russia (15.5%, a difference of 0.040%), Immigrants from Korea (15.5%, a difference of 0.060%), Immigrants from Oceania (15.4%, a difference of 0.16%), and Peruvian (15.4%, a difference of 0.28%).
| Demographics | Rating | Rank | Single Father Poverty |
| Immigrants | Congo | 99.4 /100 | #81 | Exceptional 15.4% |
| Immigrants | Ukraine | 99.4 /100 | #82 | Exceptional 15.4% |
| Chinese | 99.3 /100 | #83 | Exceptional 15.4% |
| Peruvians | 99.2 /100 | #84 | Exceptional 15.4% |
| Immigrants | Oceania | 99.1 /100 | #85 | Exceptional 15.4% |
| Immigrants | Russia | 99.0 /100 | #86 | Exceptional 15.5% |
| Brazilians | 99.0 /100 | #87 | Exceptional 15.5% |
| Burmese | 99.0 /100 | #88 | Exceptional 15.5% |
| Immigrants | Korea | 99.0 /100 | #89 | Exceptional 15.5% |
| Mexican American Indians | 98.7 /100 | #90 | Exceptional 15.5% |
| Immigrants | Romania | 98.6 /100 | #91 | Exceptional 15.5% |
| Immigrants | Serbia | 98.5 /100 | #92 | Exceptional 15.5% |
| Basques | 98.4 /100 | #93 | Exceptional 15.5% |
| Immigrants | Uruguay | 98.2 /100 | #94 | Exceptional 15.6% |
| Immigrants | Kazakhstan | 98.2 /100 | #95 | Exceptional 15.6% |
Demographics Similar to Swiss by Single Father Poverty
In terms of single father poverty, the demographic groups most similar to Swiss are Immigrants from Zaire (17.3%, a difference of 0.13%), Lithuanian (17.3%, a difference of 0.14%), Spaniard (17.2%, a difference of 0.22%), Slovene (17.3%, a difference of 0.34%), and Polish (17.3%, a difference of 0.35%).
| Demographics | Rating | Rank | Single Father Poverty |
| Immigrants | Honduras | 0.9 /100 | #254 | Tragic 17.1% |
| Sierra Leoneans | 0.8 /100 | #255 | Tragic 17.2% |
| Immigrants | Haiti | 0.8 /100 | #256 | Tragic 17.2% |
| Immigrants | Albania | 0.7 /100 | #257 | Tragic 17.2% |
| Albanians | 0.7 /100 | #258 | Tragic 17.2% |
| Immigrants | Jamaica | 0.7 /100 | #259 | Tragic 17.2% |
| Spaniards | 0.6 /100 | #260 | Tragic 17.2% |
| Swiss | 0.5 /100 | #261 | Tragic 17.3% |
| Immigrants | Zaire | 0.4 /100 | #262 | Tragic 17.3% |
| Lithuanians | 0.4 /100 | #263 | Tragic 17.3% |
| Slovenes | 0.3 /100 | #264 | Tragic 17.3% |
| Poles | 0.3 /100 | #265 | Tragic 17.3% |
| Jamaicans | 0.3 /100 | #266 | Tragic 17.3% |
| Haitians | 0.3 /100 | #267 | Tragic 17.3% |
| Immigrants | Caribbean | 0.3 /100 | #268 | Tragic 17.4% |