Burmese vs Immigrants from Denmark Single Father Poverty
COMPARE
Burmese
Immigrants from Denmark
Single Father Poverty
Single Father Poverty Comparison
Burmese
Immigrants from Denmark
15.5%
SINGLE FATHER POVERTY
99.0/ 100
METRIC RATING
88th/ 347
METRIC RANK
16.7%
SINGLE FATHER POVERTY
8.1/ 100
METRIC RATING
220th/ 347
METRIC RANK
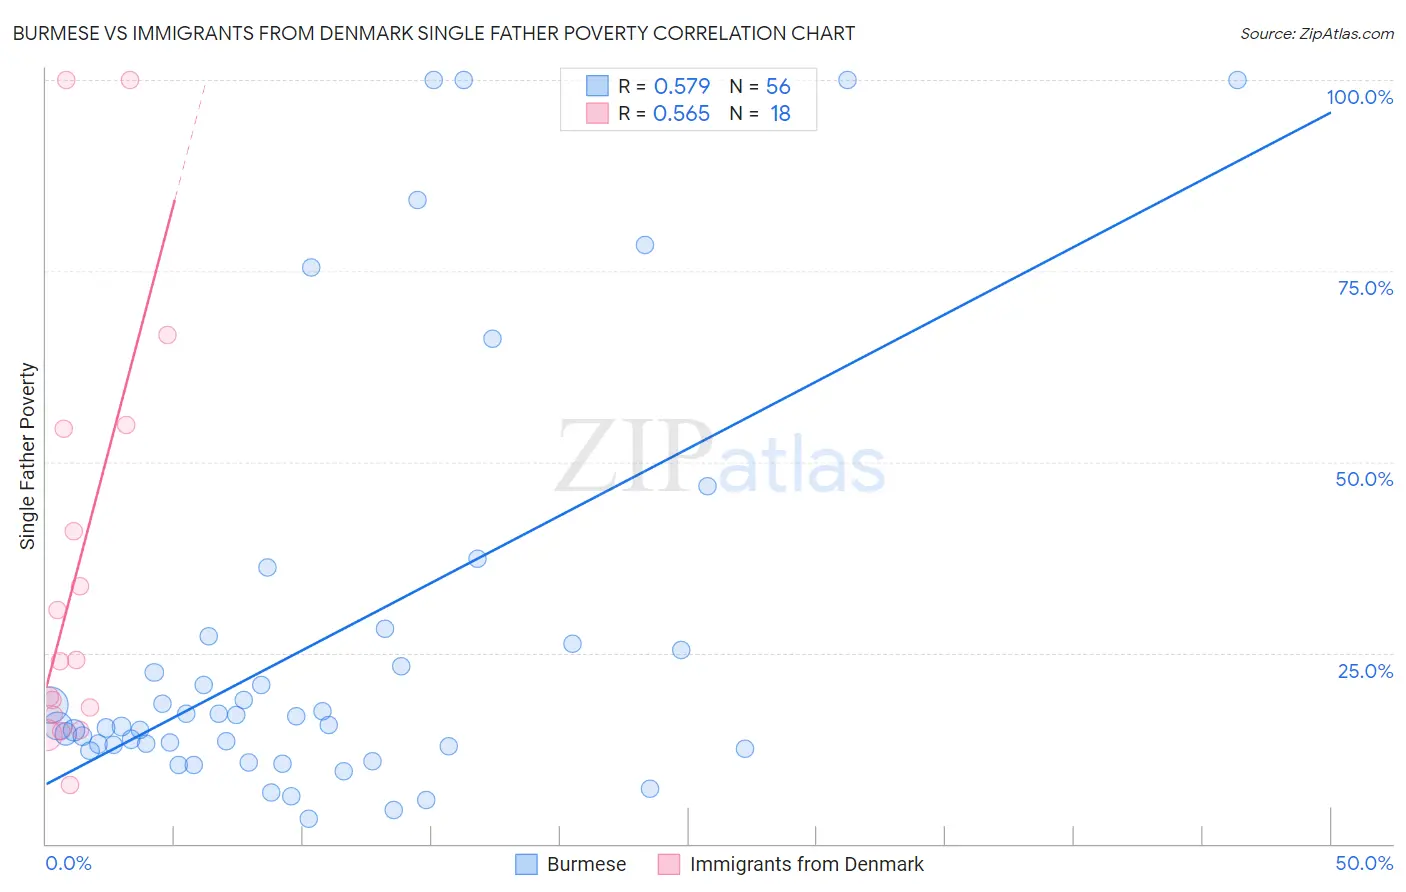
Burmese vs Immigrants from Denmark Single Father Poverty Correlation Chart
The statistical analysis conducted on geographies consisting of 355,001,827 people shows a substantial positive correlation between the proportion of Burmese and poverty level among single fathers in the United States with a correlation coefficient (R) of 0.579 and weighted average of 15.5%. Similarly, the statistical analysis conducted on geographies consisting of 116,977,797 people shows a substantial positive correlation between the proportion of Immigrants from Denmark and poverty level among single fathers in the United States with a correlation coefficient (R) of 0.565 and weighted average of 16.7%, a difference of 8.2%.
Single Father Poverty Correlation Summary
| Measurement | Burmese | Immigrants from Denmark |
| Minimum | 3.2% | 7.7% |
| Maximum | 100.0% | 100.0% |
| Range | 96.8% | 92.3% |
| Mean | 26.6% | 36.3% |
| Median | 15.4% | 24.0% |
| Interquartile 25% (IQ1) | 12.7% | 16.9% |
| Interquartile 75% (IQ3) | 25.9% | 54.3% |
| Interquartile Range (IQR) | 13.2% | 37.4% |
| Standard Deviation (Sample) | 26.9% | 28.3% |
| Standard Deviation (Population) | 26.7% | 27.5% |
Similar Demographics by Single Father Poverty
Demographics Similar to Burmese by Single Father Poverty
In terms of single father poverty, the demographic groups most similar to Burmese are Brazilian (15.5%, a difference of 0.030%), Immigrants from Russia (15.5%, a difference of 0.040%), Immigrants from Korea (15.5%, a difference of 0.060%), Immigrants from Oceania (15.4%, a difference of 0.16%), and Peruvian (15.4%, a difference of 0.28%).
| Demographics | Rating | Rank | Single Father Poverty |
| Immigrants | Congo | 99.4 /100 | #81 | Exceptional 15.4% |
| Immigrants | Ukraine | 99.4 /100 | #82 | Exceptional 15.4% |
| Chinese | 99.3 /100 | #83 | Exceptional 15.4% |
| Peruvians | 99.2 /100 | #84 | Exceptional 15.4% |
| Immigrants | Oceania | 99.1 /100 | #85 | Exceptional 15.4% |
| Immigrants | Russia | 99.0 /100 | #86 | Exceptional 15.5% |
| Brazilians | 99.0 /100 | #87 | Exceptional 15.5% |
| Burmese | 99.0 /100 | #88 | Exceptional 15.5% |
| Immigrants | Korea | 99.0 /100 | #89 | Exceptional 15.5% |
| Mexican American Indians | 98.7 /100 | #90 | Exceptional 15.5% |
| Immigrants | Romania | 98.6 /100 | #91 | Exceptional 15.5% |
| Immigrants | Serbia | 98.5 /100 | #92 | Exceptional 15.5% |
| Basques | 98.4 /100 | #93 | Exceptional 15.5% |
| Immigrants | Uruguay | 98.2 /100 | #94 | Exceptional 15.6% |
| Immigrants | Kazakhstan | 98.2 /100 | #95 | Exceptional 15.6% |
Demographics Similar to Immigrants from Denmark by Single Father Poverty
In terms of single father poverty, the demographic groups most similar to Immigrants from Denmark are Immigrants from Greece (16.7%, a difference of 0.0%), Immigrants from Ghana (16.7%, a difference of 0.010%), Immigrants from Spain (16.7%, a difference of 0.010%), Immigrants from Uganda (16.7%, a difference of 0.070%), and Cheyenne (16.7%, a difference of 0.17%).
| Demographics | Rating | Rank | Single Father Poverty |
| Ghanaians | 11.0 /100 | #213 | Poor 16.7% |
| Spanish | 10.7 /100 | #214 | Poor 16.7% |
| Immigrants | Scotland | 9.6 /100 | #215 | Tragic 16.7% |
| Immigrants | England | 9.5 /100 | #216 | Tragic 16.7% |
| Cheyenne | 9.3 /100 | #217 | Tragic 16.7% |
| Immigrants | Uganda | 8.6 /100 | #218 | Tragic 16.7% |
| Immigrants | Ghana | 8.1 /100 | #219 | Tragic 16.7% |
| Immigrants | Denmark | 8.1 /100 | #220 | Tragic 16.7% |
| Immigrants | Greece | 8.1 /100 | #221 | Tragic 16.7% |
| Immigrants | Spain | 8.0 /100 | #222 | Tragic 16.7% |
| Immigrants | Austria | 7.0 /100 | #223 | Tragic 16.8% |
| Immigrants | Norway | 6.5 /100 | #224 | Tragic 16.8% |
| Menominee | 6.4 /100 | #225 | Tragic 16.8% |
| Hispanics or Latinos | 6.1 /100 | #226 | Tragic 16.8% |
| British | 5.6 /100 | #227 | Tragic 16.8% |