Burmese vs Ugandan Unemployment Among Women with Children Ages 6 to 17 years
COMPARE
Burmese
Ugandan
Unemployment Among Women with Children Ages 6 to 17 years
Unemployment Among Women with Children Ages 6 to 17 years Comparison
Burmese
Ugandans
8.0%
UNEMPLOYMENT AMONG WOMEN WITH CHILDREN AGES 6 TO 17 YEARS
100.0/ 100
METRIC RATING
36th/ 347
METRIC RANK
12.0%
UNEMPLOYMENT AMONG WOMEN WITH CHILDREN AGES 6 TO 17 YEARS
0.0/ 100
METRIC RATING
334th/ 347
METRIC RANK
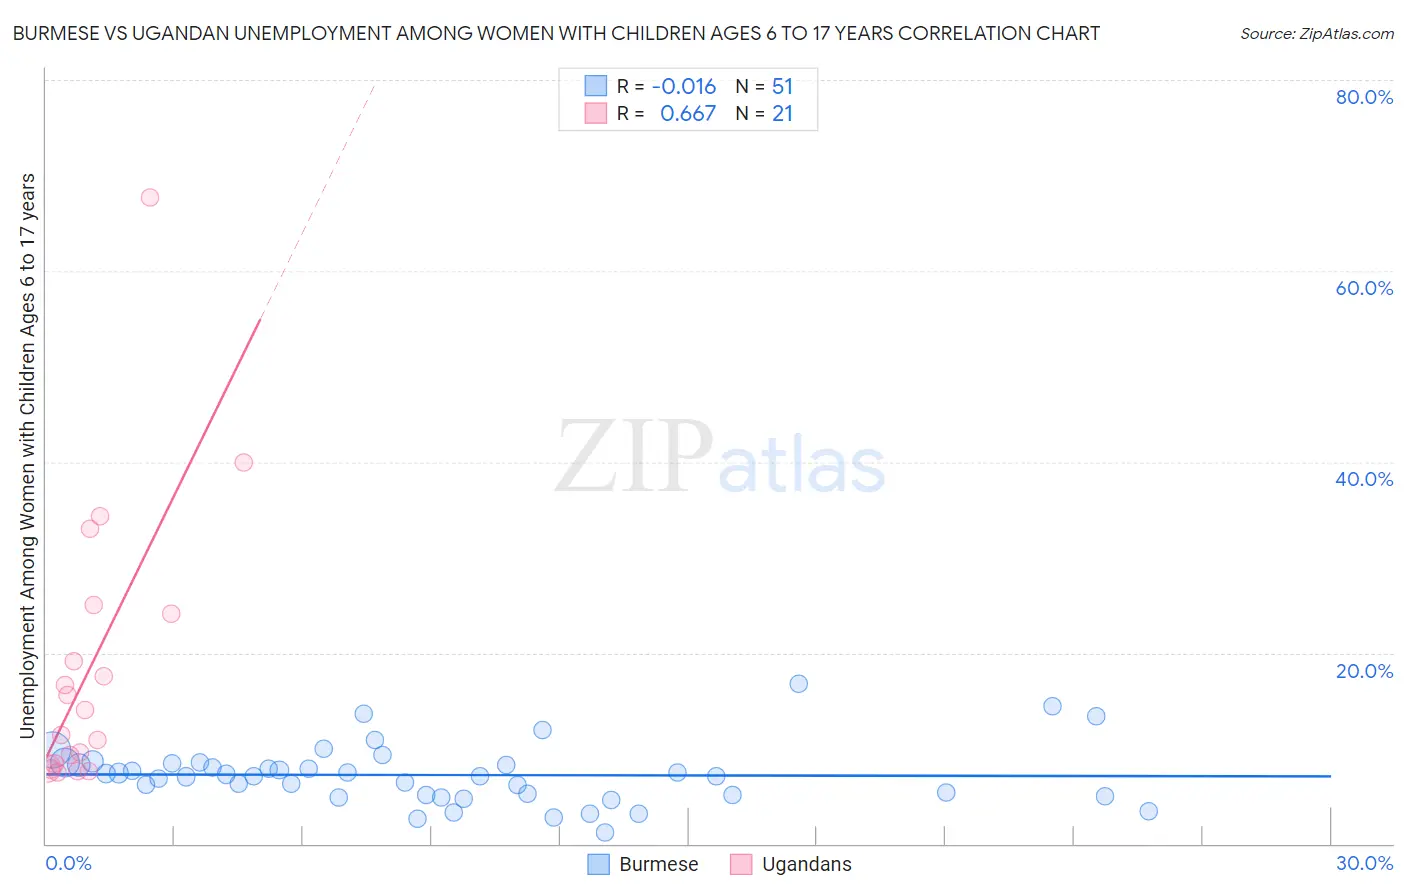
Burmese vs Ugandan Unemployment Among Women with Children Ages 6 to 17 years Correlation Chart
The statistical analysis conducted on geographies consisting of 320,179,112 people shows no correlation between the proportion of Burmese and unemployment rate among women with children between the ages 6 and 17 in the United States with a correlation coefficient (R) of -0.016 and weighted average of 8.0%. Similarly, the statistical analysis conducted on geographies consisting of 84,445,978 people shows a significant positive correlation between the proportion of Ugandans and unemployment rate among women with children between the ages 6 and 17 in the United States with a correlation coefficient (R) of 0.667 and weighted average of 12.0%, a difference of 51.1%.
Unemployment Among Women with Children Ages 6 to 17 years Correlation Summary
| Measurement | Burmese | Ugandan |
| Minimum | 1.2% | 7.4% |
| Maximum | 16.8% | 67.7% |
| Range | 15.6% | 60.3% |
| Mean | 7.2% | 18.8% |
| Median | 7.1% | 14.0% |
| Interquartile 25% (IQ1) | 5.1% | 8.1% |
| Interquartile 75% (IQ3) | 8.4% | 24.6% |
| Interquartile Range (IQR) | 3.3% | 16.4% |
| Standard Deviation (Sample) | 3.1% | 14.9% |
| Standard Deviation (Population) | 3.1% | 14.5% |
Similar Demographics by Unemployment Among Women with Children Ages 6 to 17 years
Demographics Similar to Burmese by Unemployment Among Women with Children Ages 6 to 17 years
In terms of unemployment among women with children ages 6 to 17 years, the demographic groups most similar to Burmese are Asian (8.0%, a difference of 0.030%), Immigrants from South Central Asia (7.9%, a difference of 0.080%), Native Hawaiian (7.9%, a difference of 0.18%), Alsatian (8.0%, a difference of 0.36%), and Immigrants from Korea (7.9%, a difference of 0.47%).
| Demographics | Rating | Rank | Unemployment Among Women with Children Ages 6 to 17 years |
| Thais | 100.0 /100 | #29 | Exceptional 7.8% |
| Immigrants | Iran | 100.0 /100 | #30 | Exceptional 7.9% |
| Laotians | 100.0 /100 | #31 | Exceptional 7.9% |
| Immigrants | Cambodia | 100.0 /100 | #32 | Exceptional 7.9% |
| Immigrants | Korea | 100.0 /100 | #33 | Exceptional 7.9% |
| Native Hawaiians | 100.0 /100 | #34 | Exceptional 7.9% |
| Immigrants | South Central Asia | 100.0 /100 | #35 | Exceptional 7.9% |
| Burmese | 100.0 /100 | #36 | Exceptional 8.0% |
| Asians | 100.0 /100 | #37 | Exceptional 8.0% |
| Alsatians | 100.0 /100 | #38 | Exceptional 8.0% |
| Somalis | 100.0 /100 | #39 | Exceptional 8.0% |
| Immigrants | Zimbabwe | 100.0 /100 | #40 | Exceptional 8.0% |
| Iranians | 100.0 /100 | #41 | Exceptional 8.0% |
| Immigrants | Somalia | 100.0 /100 | #42 | Exceptional 8.0% |
| Bhutanese | 100.0 /100 | #43 | Exceptional 8.1% |
Demographics Similar to Ugandans by Unemployment Among Women with Children Ages 6 to 17 years
In terms of unemployment among women with children ages 6 to 17 years, the demographic groups most similar to Ugandans are Colville (12.3%, a difference of 2.7%), Houma (12.5%, a difference of 3.7%), Native/Alaskan (11.5%, a difference of 4.9%), Tsimshian (11.4%, a difference of 5.6%), and Black/African American (11.4%, a difference of 5.7%).
| Demographics | Rating | Rank | Unemployment Among Women with Children Ages 6 to 17 years |
| Cape Verdeans | 0.0 /100 | #327 | Tragic 10.9% |
| Ottawa | 0.0 /100 | #328 | Tragic 10.9% |
| Pennsylvania Germans | 0.0 /100 | #329 | Tragic 11.0% |
| Chippewa | 0.0 /100 | #330 | Tragic 11.1% |
| Blacks/African Americans | 0.0 /100 | #331 | Tragic 11.4% |
| Tsimshian | 0.0 /100 | #332 | Tragic 11.4% |
| Natives/Alaskans | 0.0 /100 | #333 | Tragic 11.5% |
| Ugandans | 0.0 /100 | #334 | Tragic 12.0% |
| Colville | 0.0 /100 | #335 | Tragic 12.3% |
| Houma | 0.0 /100 | #336 | Tragic 12.5% |
| Immigrants | Yemen | 0.0 /100 | #337 | Tragic 12.7% |
| Hopi | 0.0 /100 | #338 | Tragic 12.9% |
| Sioux | 0.0 /100 | #339 | Tragic 13.2% |
| Puerto Ricans | 0.0 /100 | #340 | Tragic 13.9% |
| Navajo | 0.0 /100 | #341 | Tragic 14.2% |