Bulgarian vs Immigrants from Jordan Male Poverty
COMPARE
Bulgarian
Immigrants from Jordan
Male Poverty
Male Poverty Comparison
Bulgarians
Immigrants from Jordan
9.3%
MALE POVERTY
99.9/ 100
METRIC RATING
10th/ 347
METRIC RANK
10.8%
MALE POVERTY
77.5/ 100
METRIC RATING
139th/ 347
METRIC RANK
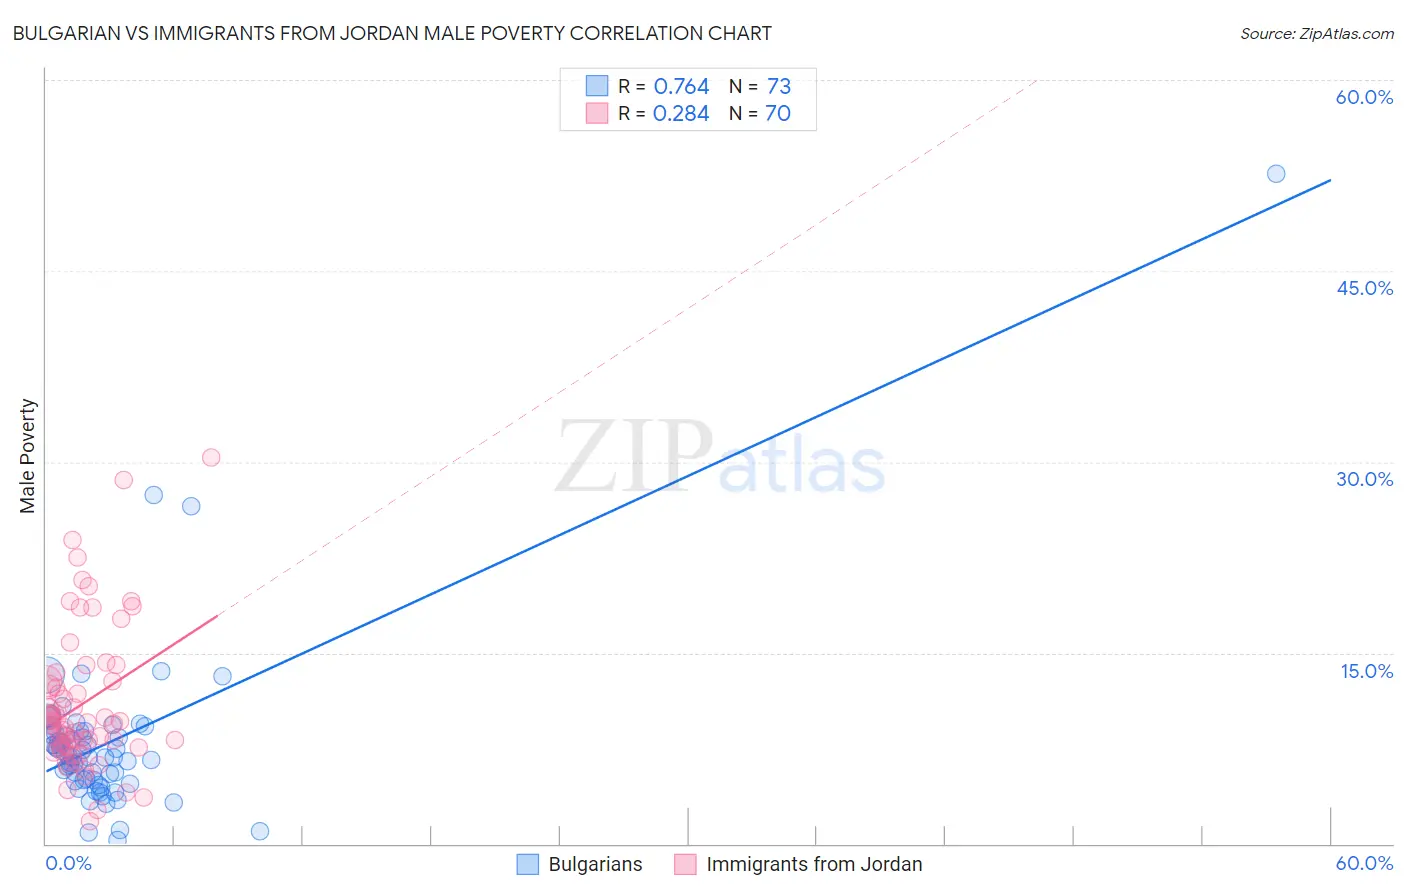
Bulgarian vs Immigrants from Jordan Male Poverty Correlation Chart
The statistical analysis conducted on geographies consisting of 205,546,988 people shows a strong positive correlation between the proportion of Bulgarians and poverty level among males in the United States with a correlation coefficient (R) of 0.764 and weighted average of 9.3%. Similarly, the statistical analysis conducted on geographies consisting of 181,249,904 people shows a weak positive correlation between the proportion of Immigrants from Jordan and poverty level among males in the United States with a correlation coefficient (R) of 0.284 and weighted average of 10.8%, a difference of 16.3%.
Male Poverty Correlation Summary
| Measurement | Bulgarian | Immigrants from Jordan |
| Minimum | 0.33% | 1.8% |
| Maximum | 52.6% | 30.3% |
| Range | 52.3% | 28.5% |
| Mean | 8.0% | 11.0% |
| Median | 6.8% | 9.5% |
| Interquartile 25% (IQ1) | 5.0% | 7.6% |
| Interquartile 75% (IQ3) | 8.8% | 12.7% |
| Interquartile Range (IQR) | 3.8% | 5.2% |
| Standard Deviation (Sample) | 6.8% | 5.7% |
| Standard Deviation (Population) | 6.8% | 5.7% |
Similar Demographics by Male Poverty
Demographics Similar to Bulgarians by Male Poverty
In terms of male poverty, the demographic groups most similar to Bulgarians are Immigrants from South Central Asia (9.3%, a difference of 0.56%), Bolivian (9.4%, a difference of 0.64%), Immigrants from Bolivia (9.4%, a difference of 0.69%), Immigrants from Lithuania (9.4%, a difference of 0.82%), and Immigrants from North Macedonia (9.4%, a difference of 1.2%).
| Demographics | Rating | Rank | Male Poverty |
| Thais | 100.0 /100 | #3 | Exceptional 8.7% |
| Immigrants | Taiwan | 100.0 /100 | #4 | Exceptional 8.9% |
| Maltese | 100.0 /100 | #5 | Exceptional 9.1% |
| Assyrians/Chaldeans/Syriacs | 99.9 /100 | #6 | Exceptional 9.1% |
| Immigrants | Ireland | 99.9 /100 | #7 | Exceptional 9.1% |
| Filipinos | 99.9 /100 | #8 | Exceptional 9.2% |
| Immigrants | South Central Asia | 99.9 /100 | #9 | Exceptional 9.3% |
| Bulgarians | 99.9 /100 | #10 | Exceptional 9.3% |
| Bolivians | 99.9 /100 | #11 | Exceptional 9.4% |
| Immigrants | Bolivia | 99.9 /100 | #12 | Exceptional 9.4% |
| Immigrants | Lithuania | 99.9 /100 | #13 | Exceptional 9.4% |
| Immigrants | North Macedonia | 99.8 /100 | #14 | Exceptional 9.4% |
| Bhutanese | 99.8 /100 | #15 | Exceptional 9.5% |
| Luxembourgers | 99.8 /100 | #16 | Exceptional 9.5% |
| Norwegians | 99.8 /100 | #17 | Exceptional 9.5% |
Demographics Similar to Immigrants from Jordan by Male Poverty
In terms of male poverty, the demographic groups most similar to Immigrants from Jordan are Yugoslavian (10.8%, a difference of 0.12%), Tlingit-Haida (10.9%, a difference of 0.19%), Immigrants from France (10.9%, a difference of 0.23%), Immigrants from Switzerland (10.8%, a difference of 0.27%), and Basque (10.9%, a difference of 0.40%).
| Demographics | Rating | Rank | Male Poverty |
| Immigrants | Vietnam | 83.0 /100 | #132 | Excellent 10.8% |
| Pakistanis | 83.0 /100 | #133 | Excellent 10.8% |
| New Zealanders | 82.9 /100 | #134 | Excellent 10.8% |
| Brazilians | 82.7 /100 | #135 | Excellent 10.8% |
| Immigrants | Israel | 80.9 /100 | #136 | Excellent 10.8% |
| Immigrants | Switzerland | 79.2 /100 | #137 | Good 10.8% |
| Yugoslavians | 78.2 /100 | #138 | Good 10.8% |
| Immigrants | Jordan | 77.5 /100 | #139 | Good 10.8% |
| Tlingit-Haida | 76.1 /100 | #140 | Good 10.9% |
| Immigrants | France | 75.8 /100 | #141 | Good 10.9% |
| Basques | 74.6 /100 | #142 | Good 10.9% |
| Afghans | 71.9 /100 | #143 | Good 10.9% |
| Samoans | 71.8 /100 | #144 | Good 10.9% |
| Immigrants | Germany | 71.6 /100 | #145 | Good 10.9% |
| Syrians | 71.4 /100 | #146 | Good 10.9% |