Guatemalan vs Immigrants from Jordan Male Poverty
COMPARE
Guatemalan
Immigrants from Jordan
Male Poverty
Male Poverty Comparison
Guatemalans
Immigrants from Jordan
13.8%
MALE POVERTY
0.0/ 100
METRIC RATING
289th/ 347
METRIC RANK
10.8%
MALE POVERTY
77.5/ 100
METRIC RATING
139th/ 347
METRIC RANK
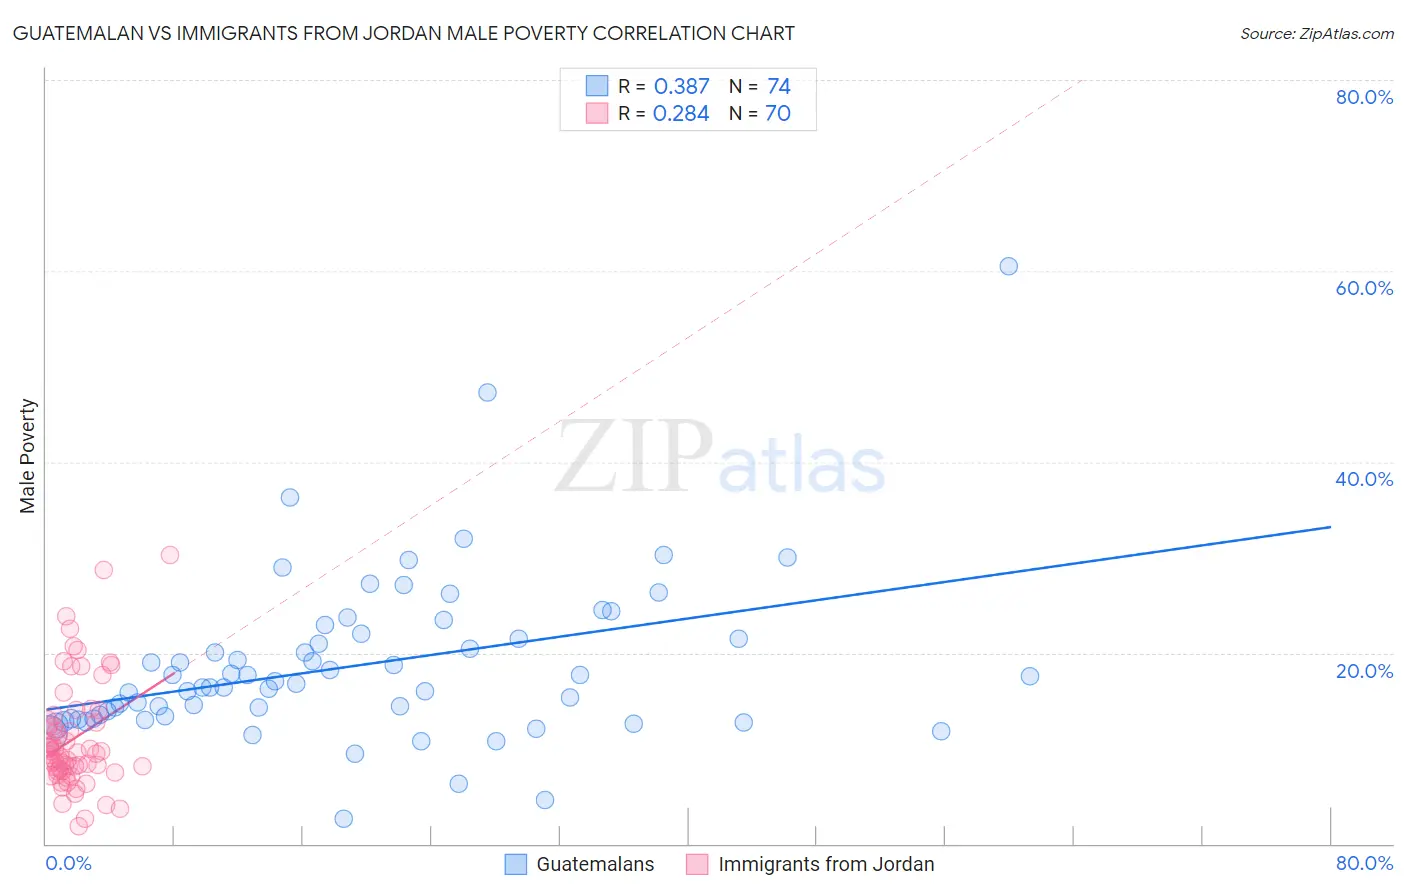
Guatemalan vs Immigrants from Jordan Male Poverty Correlation Chart
The statistical analysis conducted on geographies consisting of 409,206,123 people shows a mild positive correlation between the proportion of Guatemalans and poverty level among males in the United States with a correlation coefficient (R) of 0.387 and weighted average of 13.8%. Similarly, the statistical analysis conducted on geographies consisting of 181,249,904 people shows a weak positive correlation between the proportion of Immigrants from Jordan and poverty level among males in the United States with a correlation coefficient (R) of 0.284 and weighted average of 10.8%, a difference of 27.3%.
Male Poverty Correlation Summary
| Measurement | Guatemalan | Immigrants from Jordan |
| Minimum | 2.7% | 1.8% |
| Maximum | 60.5% | 30.3% |
| Range | 57.9% | 28.5% |
| Mean | 18.7% | 11.0% |
| Median | 16.6% | 9.5% |
| Interquartile 25% (IQ1) | 13.1% | 7.6% |
| Interquartile 75% (IQ3) | 21.5% | 12.7% |
| Interquartile Range (IQR) | 8.4% | 5.2% |
| Standard Deviation (Sample) | 8.7% | 5.7% |
| Standard Deviation (Population) | 8.7% | 5.7% |
Similar Demographics by Male Poverty
Demographics Similar to Guatemalans by Male Poverty
In terms of male poverty, the demographic groups most similar to Guatemalans are Immigrants from Zaire (13.8%, a difference of 0.010%), Vietnamese (13.8%, a difference of 0.10%), Immigrants from St. Vincent and the Grenadines (13.8%, a difference of 0.17%), Indonesian (13.8%, a difference of 0.26%), and Immigrants from Belize (13.8%, a difference of 0.27%).
| Demographics | Rating | Rank | Male Poverty |
| Immigrants | Cabo Verde | 0.0 /100 | #282 | Tragic 13.7% |
| Comanche | 0.0 /100 | #283 | Tragic 13.8% |
| Immigrants | Haiti | 0.0 /100 | #284 | Tragic 13.8% |
| West Indians | 0.0 /100 | #285 | Tragic 13.8% |
| Shoshone | 0.0 /100 | #286 | Tragic 13.8% |
| Immigrants | Barbados | 0.0 /100 | #287 | Tragic 13.8% |
| Immigrants | St. Vincent and the Grenadines | 0.0 /100 | #288 | Tragic 13.8% |
| Guatemalans | 0.0 /100 | #289 | Tragic 13.8% |
| Immigrants | Zaire | 0.0 /100 | #290 | Tragic 13.8% |
| Vietnamese | 0.0 /100 | #291 | Tragic 13.8% |
| Indonesians | 0.0 /100 | #292 | Tragic 13.8% |
| Immigrants | Belize | 0.0 /100 | #293 | Tragic 13.8% |
| Hispanics or Latinos | 0.0 /100 | #294 | Tragic 13.9% |
| Immigrants | Central America | 0.0 /100 | #295 | Tragic 13.9% |
| Cajuns | 0.0 /100 | #296 | Tragic 13.9% |
Demographics Similar to Immigrants from Jordan by Male Poverty
In terms of male poverty, the demographic groups most similar to Immigrants from Jordan are Yugoslavian (10.8%, a difference of 0.12%), Tlingit-Haida (10.9%, a difference of 0.19%), Immigrants from France (10.9%, a difference of 0.23%), Immigrants from Switzerland (10.8%, a difference of 0.27%), and Basque (10.9%, a difference of 0.40%).
| Demographics | Rating | Rank | Male Poverty |
| Immigrants | Vietnam | 83.0 /100 | #132 | Excellent 10.8% |
| Pakistanis | 83.0 /100 | #133 | Excellent 10.8% |
| New Zealanders | 82.9 /100 | #134 | Excellent 10.8% |
| Brazilians | 82.7 /100 | #135 | Excellent 10.8% |
| Immigrants | Israel | 80.9 /100 | #136 | Excellent 10.8% |
| Immigrants | Switzerland | 79.2 /100 | #137 | Good 10.8% |
| Yugoslavians | 78.2 /100 | #138 | Good 10.8% |
| Immigrants | Jordan | 77.5 /100 | #139 | Good 10.8% |
| Tlingit-Haida | 76.1 /100 | #140 | Good 10.9% |
| Immigrants | France | 75.8 /100 | #141 | Good 10.9% |
| Basques | 74.6 /100 | #142 | Good 10.9% |
| Afghans | 71.9 /100 | #143 | Good 10.9% |
| Samoans | 71.8 /100 | #144 | Good 10.9% |
| Immigrants | Germany | 71.6 /100 | #145 | Good 10.9% |
| Syrians | 71.4 /100 | #146 | Good 10.9% |