Bulgarian vs Immigrants from Colombia Male Poverty
COMPARE
Bulgarian
Immigrants from Colombia
Male Poverty
Male Poverty Comparison
Bulgarians
Immigrants from Colombia
9.3%
MALE POVERTY
99.9/ 100
METRIC RATING
10th/ 347
METRIC RANK
11.1%
MALE POVERTY
54.2/ 100
METRIC RATING
169th/ 347
METRIC RANK
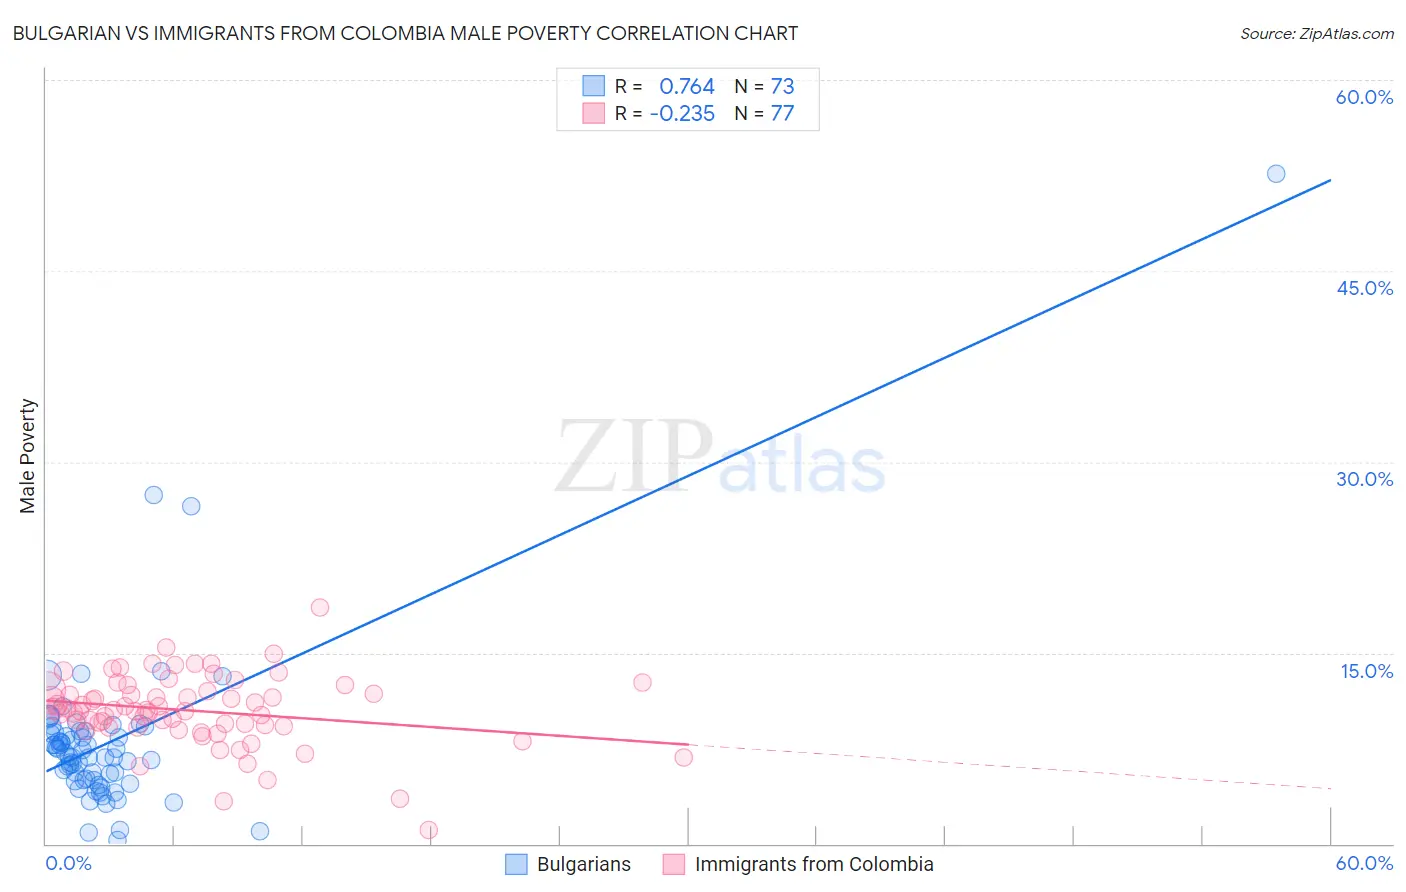
Bulgarian vs Immigrants from Colombia Male Poverty Correlation Chart
The statistical analysis conducted on geographies consisting of 205,546,988 people shows a strong positive correlation between the proportion of Bulgarians and poverty level among males in the United States with a correlation coefficient (R) of 0.764 and weighted average of 9.3%. Similarly, the statistical analysis conducted on geographies consisting of 378,363,943 people shows a weak negative correlation between the proportion of Immigrants from Colombia and poverty level among males in the United States with a correlation coefficient (R) of -0.235 and weighted average of 11.1%, a difference of 19.5%.
Male Poverty Correlation Summary
| Measurement | Bulgarian | Immigrants from Colombia |
| Minimum | 0.33% | 1.0% |
| Maximum | 52.6% | 18.6% |
| Range | 52.3% | 17.5% |
| Mean | 8.0% | 10.4% |
| Median | 6.8% | 10.5% |
| Interquartile 25% (IQ1) | 5.0% | 9.2% |
| Interquartile 75% (IQ3) | 8.8% | 12.0% |
| Interquartile Range (IQR) | 3.8% | 2.8% |
| Standard Deviation (Sample) | 6.8% | 2.8% |
| Standard Deviation (Population) | 6.8% | 2.8% |
Similar Demographics by Male Poverty
Demographics Similar to Bulgarians by Male Poverty
In terms of male poverty, the demographic groups most similar to Bulgarians are Immigrants from South Central Asia (9.3%, a difference of 0.56%), Bolivian (9.4%, a difference of 0.64%), Immigrants from Bolivia (9.4%, a difference of 0.69%), Immigrants from Lithuania (9.4%, a difference of 0.82%), and Immigrants from North Macedonia (9.4%, a difference of 1.2%).
| Demographics | Rating | Rank | Male Poverty |
| Thais | 100.0 /100 | #3 | Exceptional 8.7% |
| Immigrants | Taiwan | 100.0 /100 | #4 | Exceptional 8.9% |
| Maltese | 100.0 /100 | #5 | Exceptional 9.1% |
| Assyrians/Chaldeans/Syriacs | 99.9 /100 | #6 | Exceptional 9.1% |
| Immigrants | Ireland | 99.9 /100 | #7 | Exceptional 9.1% |
| Filipinos | 99.9 /100 | #8 | Exceptional 9.2% |
| Immigrants | South Central Asia | 99.9 /100 | #9 | Exceptional 9.3% |
| Bulgarians | 99.9 /100 | #10 | Exceptional 9.3% |
| Bolivians | 99.9 /100 | #11 | Exceptional 9.4% |
| Immigrants | Bolivia | 99.9 /100 | #12 | Exceptional 9.4% |
| Immigrants | Lithuania | 99.9 /100 | #13 | Exceptional 9.4% |
| Immigrants | North Macedonia | 99.8 /100 | #14 | Exceptional 9.4% |
| Bhutanese | 99.8 /100 | #15 | Exceptional 9.5% |
| Luxembourgers | 99.8 /100 | #16 | Exceptional 9.5% |
| Norwegians | 99.8 /100 | #17 | Exceptional 9.5% |
Demographics Similar to Immigrants from Colombia by Male Poverty
In terms of male poverty, the demographic groups most similar to Immigrants from Colombia are South American (11.1%, a difference of 0.040%), Immigrants from Portugal (11.1%, a difference of 0.070%), Hungarian (11.1%, a difference of 0.090%), Immigrants from Albania (11.1%, a difference of 0.11%), and Immigrants from Spain (11.1%, a difference of 0.13%).
| Demographics | Rating | Rank | Male Poverty |
| Immigrants | Chile | 57.4 /100 | #162 | Average 11.1% |
| Whites/Caucasians | 56.7 /100 | #163 | Average 11.1% |
| Ethiopians | 56.7 /100 | #164 | Average 11.1% |
| Immigrants | Spain | 55.5 /100 | #165 | Average 11.1% |
| Immigrants | Albania | 55.3 /100 | #166 | Average 11.1% |
| Hungarians | 55.1 /100 | #167 | Average 11.1% |
| Immigrants | Portugal | 54.9 /100 | #168 | Average 11.1% |
| Immigrants | Colombia | 54.2 /100 | #169 | Average 11.1% |
| South Americans | 53.8 /100 | #170 | Average 11.1% |
| Uruguayans | 51.0 /100 | #171 | Average 11.2% |
| Immigrants | Ethiopia | 50.7 /100 | #172 | Average 11.2% |
| Pennsylvania Germans | 50.5 /100 | #173 | Average 11.2% |
| Immigrants | Oceania | 50.0 /100 | #174 | Average 11.2% |
| Celtics | 47.5 /100 | #175 | Average 11.2% |
| Immigrants | Fiji | 46.0 /100 | #176 | Average 11.2% |