British West Indian vs Laotian Child Poverty Under the Age of 5
COMPARE
British West Indian
Laotian
Child Poverty Under the Age of 5
Child Poverty Under the Age of 5 Comparison
British West Indians
Laotians
21.4%
CHILD POVERTY UNDER THE AGE OF 5
0.0/ 100
METRIC RATING
291st/ 347
METRIC RANK
14.7%
CHILD POVERTY UNDER THE AGE OF 5
99.6/ 100
METRIC RATING
45th/ 347
METRIC RANK
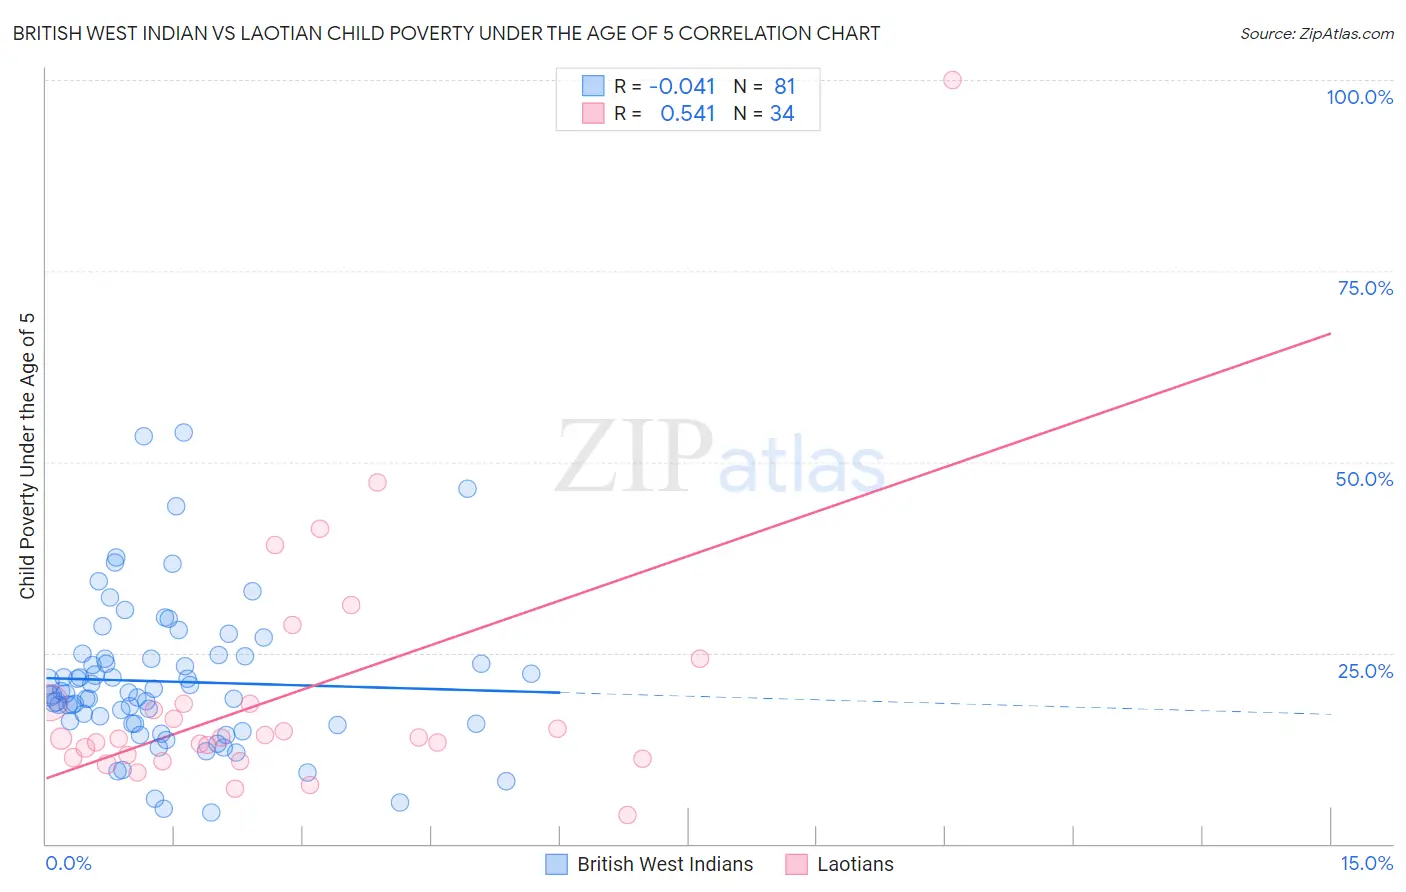
British West Indian vs Laotian Child Poverty Under the Age of 5 Correlation Chart
The statistical analysis conducted on geographies consisting of 150,575,514 people shows no correlation between the proportion of British West Indians and poverty level among children under the age of 5 in the United States with a correlation coefficient (R) of -0.041 and weighted average of 21.4%. Similarly, the statistical analysis conducted on geographies consisting of 219,686,525 people shows a substantial positive correlation between the proportion of Laotians and poverty level among children under the age of 5 in the United States with a correlation coefficient (R) of 0.541 and weighted average of 14.7%, a difference of 45.5%.
Child Poverty Under the Age of 5 Correlation Summary
| Measurement | British West Indian | Laotian |
| Minimum | 4.1% | 3.8% |
| Maximum | 53.9% | 100.0% |
| Range | 49.8% | 96.2% |
| Mean | 21.2% | 19.4% |
| Median | 19.5% | 13.8% |
| Interquartile 25% (IQ1) | 15.7% | 11.3% |
| Interquartile 75% (IQ3) | 24.4% | 18.3% |
| Interquartile Range (IQR) | 8.7% | 7.0% |
| Standard Deviation (Sample) | 9.7% | 17.3% |
| Standard Deviation (Population) | 9.6% | 17.0% |
Similar Demographics by Child Poverty Under the Age of 5
Demographics Similar to British West Indians by Child Poverty Under the Age of 5
In terms of child poverty under the age of 5, the demographic groups most similar to British West Indians are Immigrants from Caribbean (21.4%, a difference of 0.17%), Immigrants from Haiti (21.3%, a difference of 0.58%), Immigrants from Somalia (21.6%, a difference of 0.60%), Immigrants from Senegal (21.3%, a difference of 0.65%), and Immigrants from Zaire (21.3%, a difference of 0.82%).
| Demographics | Rating | Rank | Child Poverty Under the Age of 5 |
| Somalis | 0.0 /100 | #284 | Tragic 21.1% |
| Haitians | 0.0 /100 | #285 | Tragic 21.2% |
| Immigrants | Latin America | 0.0 /100 | #286 | Tragic 21.2% |
| Immigrants | Zaire | 0.0 /100 | #287 | Tragic 21.3% |
| Immigrants | Senegal | 0.0 /100 | #288 | Tragic 21.3% |
| Immigrants | Haiti | 0.0 /100 | #289 | Tragic 21.3% |
| Immigrants | Caribbean | 0.0 /100 | #290 | Tragic 21.4% |
| British West Indians | 0.0 /100 | #291 | Tragic 21.4% |
| Immigrants | Somalia | 0.0 /100 | #292 | Tragic 21.6% |
| Mexicans | 0.0 /100 | #293 | Tragic 21.6% |
| Guatemalans | 0.0 /100 | #294 | Tragic 21.6% |
| Cherokee | 0.0 /100 | #295 | Tragic 21.7% |
| Yaqui | 0.0 /100 | #296 | Tragic 21.7% |
| Hispanics or Latinos | 0.0 /100 | #297 | Tragic 21.7% |
| Blackfeet | 0.0 /100 | #298 | Tragic 21.8% |
Demographics Similar to Laotians by Child Poverty Under the Age of 5
In terms of child poverty under the age of 5, the demographic groups most similar to Laotians are Tsimshian (14.7%, a difference of 0.080%), Immigrants from Philippines (14.7%, a difference of 0.13%), Russian (14.8%, a difference of 0.21%), Soviet Union (14.7%, a difference of 0.26%), and Immigrants from Greece (14.7%, a difference of 0.26%).
| Demographics | Rating | Rank | Child Poverty Under the Age of 5 |
| Eastern Europeans | 99.7 /100 | #38 | Exceptional 14.6% |
| Norwegians | 99.7 /100 | #39 | Exceptional 14.6% |
| Immigrants | Australia | 99.7 /100 | #40 | Exceptional 14.6% |
| Immigrants | Belarus | 99.7 /100 | #41 | Exceptional 14.7% |
| Soviet Union | 99.7 /100 | #42 | Exceptional 14.7% |
| Immigrants | Greece | 99.7 /100 | #43 | Exceptional 14.7% |
| Immigrants | Philippines | 99.7 /100 | #44 | Exceptional 14.7% |
| Laotians | 99.6 /100 | #45 | Exceptional 14.7% |
| Tsimshian | 99.6 /100 | #46 | Exceptional 14.7% |
| Russians | 99.6 /100 | #47 | Exceptional 14.8% |
| Immigrants | Czechoslovakia | 99.6 /100 | #48 | Exceptional 14.8% |
| Immigrants | Bulgaria | 99.6 /100 | #49 | Exceptional 14.8% |
| Immigrants | Northern Europe | 99.6 /100 | #50 | Exceptional 14.8% |
| Estonians | 99.6 /100 | #51 | Exceptional 14.8% |
| Immigrants | Serbia | 99.5 /100 | #52 | Exceptional 14.9% |