Immigrants from Spain vs Laotian Child Poverty Under the Age of 5

COMPARE

Immigrants from Spain
Race
Ancestry
AfghanAfricanAlaska NativeAlaskan AthabascanAlbanianAleutAlsatianAmericanApacheArabArapahoArgentineanArmenianAssyrian/Chaldean/SyriacAustralianAustrianBahamianBangladeshiBarbadianBasqueBelgianBelizeanBermudanBhutaneseBlackfeetBolivianBrazilianBritishBritish West IndianBulgarianBurmeseCajunCambodianCanadianCape VerdeanCarpatho RusynCelticCentral AmericanCentral American IndianCherokeeCheyenneChickasawChileanChineseChippewaChoctawColombianColvilleComancheCosta RicanCreeCreekCroatianCrowCubanCypriotCzechCzechoslovakianDanishDelawareDominicanDutchDutch West IndianEastern EuropeanEcuadorianEgyptianEnglishEstonianEthiopianEuropeanFijianFilipinoFinnishFrenchFrench American IndianFrench CanadianGermanGerman RussianGhanaianGreekGuamanian/ChamorroGuatemalanGuyaneseHaitianHmongHonduranHopiHoumaHungarianIcelanderIndian (Asian)IndonesianInupiatIranianIraqiIrishIroquoisIsraeliItalianJamaicanJapaneseJordanianKenyanKiowaKoreanLatvianLebaneseLiberianLithuanianLumbeeLuxembourgerMacedonianMalaysianMalteseMarshalleseMenomineeMexicanMexican American IndianMongolianMoroccanNative HawaiianNavajoNepaleseNew ZealanderNicaraguanNigerianNorthern EuropeanNorwegianOkinawanOsageOttawaPaiutePakistaniPalestinianPanamanianParaguayanPennsylvania GermanPeruvianPimaPolishPortuguesePotawatomiPuebloPuerto RicanPuget Sound SalishRomanianRussianSalvadoranSamoanScandinavianScotch-IrishScottishSeminoleSenegaleseSerbianShoshoneSierra LeoneanSiouxSlavicSlovakSloveneSomaliSouth AfricanSouth AmericanSouth American IndianSoviet UnionSpaniardSpanishSpanish AmericanSpanish American IndianSri LankanSubsaharan AfricanSudaneseSwedishSwissSyrianTaiwaneseThaiTlingit-HaidaTohono O'OdhamTonganTrinidadian and TobagonianTsimshianTurkishU.S. Virgin IslanderUgandanUkrainianUruguayanUteVenezuelanVietnameseWelshWest IndianYakamaYaquiYugoslavianYumanYup'ikZimbabwean
Immigration
NonimmigrantsImmigrantsAfghanistanAfricaAlbaniaArgentinaArmeniaAsiaAustraliaAustriaBahamasBangladeshBarbadosBelarusBelgiumBelizeBoliviaBosnia and HerzegovinaBrazilBulgariaBurma/MyanmarCabo VerdeCambodiaCameroonCanadaCaribbeanCentral AmericaChileChinaColombiaCongoCosta RicaCroatiaCubaCzechoslovakiaDenmarkDominicaDominican RepublicEastern AfricaEastern AsiaEastern EuropeEcuadorEgyptEl SalvadorEnglandEritreaEthiopiaEuropeFijiFranceGermanyGhanaGreeceGrenadaGuatemalaGuyanaHaitiHondurasHong KongHungaryIndiaIndonesiaIranIraqIrelandIsraelItalyJamaicaJapanJordanKazakhstanKenyaKoreaKuwaitLaosLatin AmericaLatviaLebanonLiberiaLithuaniaMalaysiaMexicoMicronesiaMiddle AfricaMoldovaMoroccoNepalNetherlandsNicaraguaNigeriaNorth AmericaNorth MacedoniaNorthern AfricaNorthern EuropeNorwayOceaniaPakistanPanamaPeruPhilippinesPolandPortugalRomaniaRussiaSaudi ArabiaScotlandSenegalSerbiaSierra LeoneSingaporeSomaliaSouth AfricaSouth AmericaSouth Central AsiaSouth Eastern AsiaSouthern EuropeSpainSri LankaSt. Vincent and the GrenadinesSudanSwedenSwitzerlandSyriaTaiwanThailandTrinidad and TobagoTurkeyUgandaUkraineUruguayUzbekistanVenezuelaVietnamWest IndiesWestern AfricaWestern AsiaWestern EuropeYemenZaireZimbabweAzores
Laotian
Race
Ancestry
AfghanAfricanAlaska NativeAlaskan AthabascanAlbanianAleutAlsatianAmericanApacheArabArapahoArgentineanArmenianAssyrian/Chaldean/SyriacAustralianAustrianBahamianBangladeshiBarbadianBasqueBelgianBelizeanBermudanBhutaneseBlackfeetBolivianBrazilianBritishBritish West IndianBulgarianBurmeseCajunCambodianCanadianCape VerdeanCarpatho RusynCelticCentral AmericanCentral American IndianCherokeeCheyenneChickasawChileanChineseChippewaChoctawColombianColvilleComancheCosta RicanCreeCreekCroatianCrowCubanCypriotCzechCzechoslovakianDanishDelawareDominicanDutchDutch West IndianEastern EuropeanEcuadorianEgyptianEnglishEstonianEthiopianEuropeanFijianFilipinoFinnishFrenchFrench American IndianFrench CanadianGermanGerman RussianGhanaianGreekGuamanian/ChamorroGuatemalanGuyaneseHaitianHmongHonduranHopiHoumaHungarianIcelanderIndian (Asian)IndonesianInupiatIranianIraqiIrishIroquoisIsraeliItalianJamaicanJapaneseJordanianKenyanKiowaKoreanLaotianLatvianLebaneseLiberianLithuanianLumbeeLuxembourgerMacedonianMalaysianMalteseMarshalleseMenomineeMexicanMexican American IndianMongolianMoroccanNative HawaiianNavajoNepaleseNew ZealanderNicaraguanNigerianNorthern EuropeanNorwegianOkinawanOsageOttawaPaiutePakistaniPalestinianPanamanianParaguayanPennsylvania GermanPeruvianPimaPolishPortuguesePotawatomiPuebloPuerto RicanPuget Sound SalishRomanianRussianSalvadoranSamoanScandinavianScotch-IrishScottishSeminoleSenegaleseSerbianShoshoneSierra LeoneanSiouxSlavicSlovakSloveneSomaliSouth AfricanSouth AmericanSouth American IndianSoviet UnionSpaniardSpanishSpanish AmericanSpanish American IndianSri LankanSubsaharan AfricanSudaneseSwedishSwissSyrianTaiwaneseThaiTlingit-HaidaTohono O'OdhamTonganTrinidadian and TobagonianTsimshianTurkishU.S. Virgin IslanderUgandanUkrainianUruguayanUteVenezuelanVietnameseWelshWest IndianYakamaYaquiYugoslavianYumanYup'ikZimbabwean
Immigration
NonimmigrantsImmigrantsAfghanistanAfricaAlbaniaArgentinaArmeniaAsiaAustraliaAustriaBahamasBangladeshBarbadosBelarusBelgiumBelizeBoliviaBosnia and HerzegovinaBrazilBulgariaBurma/MyanmarCabo VerdeCambodiaCameroonCanadaCaribbeanCentral AmericaChileChinaColombiaCongoCosta RicaCroatiaCubaCzechoslovakiaDenmarkDominicaDominican RepublicEastern AfricaEastern AsiaEastern EuropeEcuadorEgyptEl SalvadorEnglandEritreaEthiopiaEuropeFijiFranceGermanyGhanaGreeceGrenadaGuatemalaGuyanaHaitiHondurasHong KongHungaryIndiaIndonesiaIranIraqIrelandIsraelItalyJamaicaJapanJordanKazakhstanKenyaKoreaKuwaitLaosLatin AmericaLatviaLebanonLiberiaLithuaniaMalaysiaMexicoMicronesiaMiddle AfricaMoldovaMoroccoNepalNetherlandsNicaraguaNigeriaNorth AmericaNorth MacedoniaNorthern AfricaNorthern EuropeNorwayOceaniaPakistanPanamaPeruPhilippinesPolandPortugalRomaniaRussiaSaudi ArabiaScotlandSenegalSerbiaSierra LeoneSingaporeSomaliaSouth AfricaSouth AmericaSouth Central AsiaSouth Eastern AsiaSouthern EuropeSri LankaSt. Vincent and the GrenadinesSudanSwedenSwitzerlandSyriaTaiwanThailandTrinidad and TobagoTurkeyUgandaUkraineUruguayUzbekistanVenezuelaVietnamWest IndiesWestern AfricaWestern AsiaWestern EuropeYemenZaireZimbabweAzores
Child Poverty Under the Age of 5
Income
Poverty
Unemployment
Labor Participation
Family Structure
Vehicle Availability
Education Level
Disability

Child Poverty Under the Age of 5 Comparison

Immigrants from Spain

Laotians

Exceptional
Exceptional
15.9%
CHILD POVERTY UNDER THE AGE OF 5
94.8/ 100
METRIC RATING
105th/ 347
METRIC RANK
14.7%
CHILD POVERTY UNDER THE AGE OF 5
99.6/ 100
METRIC RATING
45th/ 347
METRIC RANK

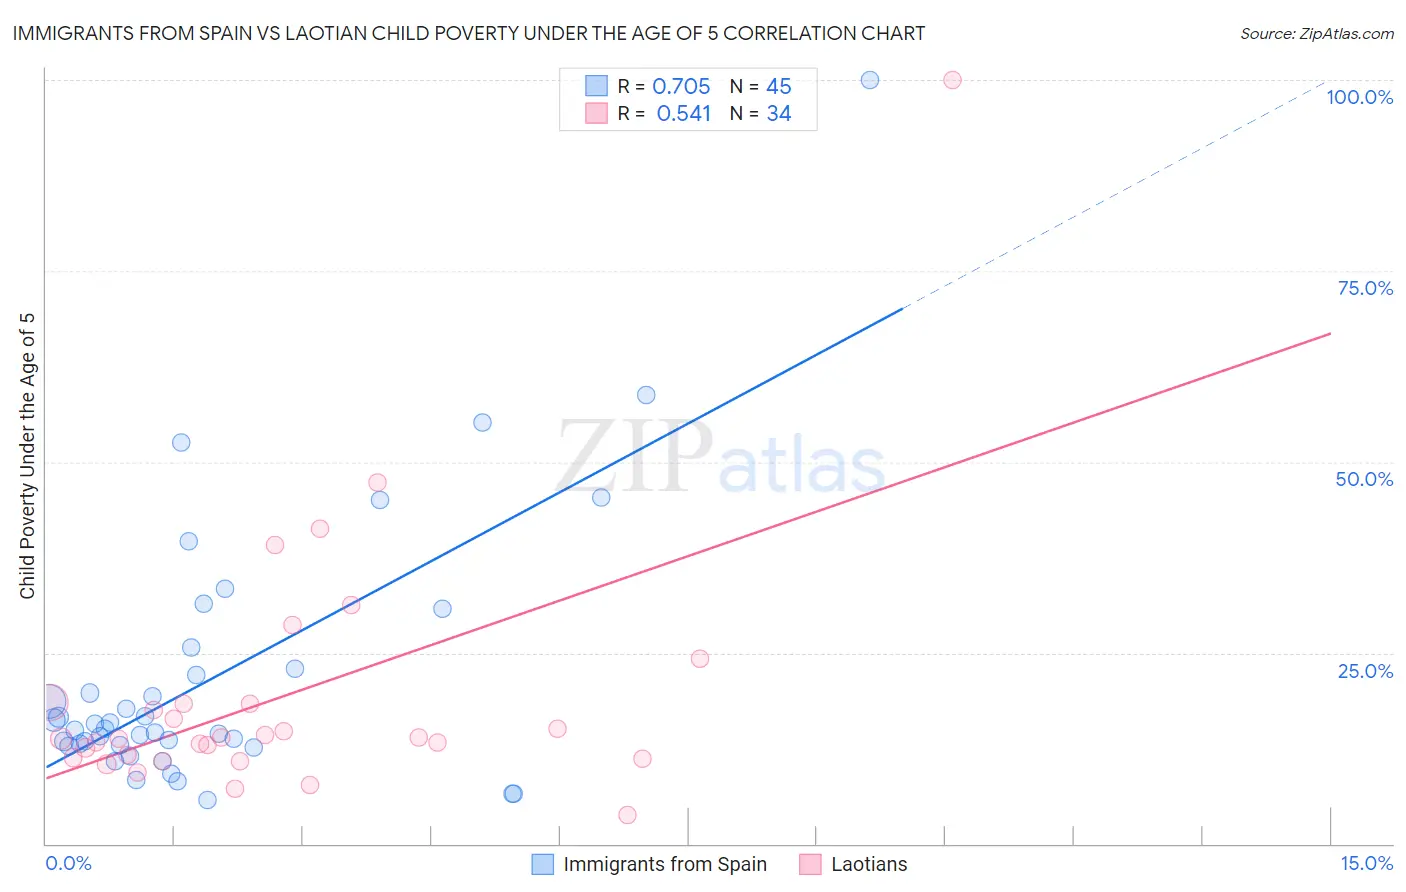
Immigrants from Spain vs Laotian Child Poverty Under the Age of 5 Correlation Chart

The statistical analysis conducted on geographies consisting of 232,438,650 people shows a strong positive correlation between the proportion of Immigrants from Spain and poverty level among children under the age of 5 in the United States with a correlation coefficient (R) of 0.705 and weighted average of 15.9%. Similarly, the statistical analysis conducted on geographies consisting of 219,686,525 people shows a substantial positive correlation between the proportion of Laotians and poverty level among children under the age of 5 in the United States with a correlation coefficient (R) of 0.541 and weighted average of 14.7%, a difference of 8.2%.
Immigrants from Spain vs Laotian Child Poverty Under the Age of 5

Child Poverty Under the Age of 5 Correlation Summary

MeasurementImmigrants from SpainLaotian
Minimum5.8%3.8%
Maximum100.0%100.0%
Range94.2%96.2%
Mean22.0%19.4%
Median15.1%13.8%
Interquartile 25% (IQ1)12.9%11.3%
Interquartile 75% (IQ3)24.3%18.3%
Interquartile Range (IQR)11.4%7.0%
Standard Deviation (Sample)17.8%17.3%
Standard Deviation (Population)17.6%17.0%

Similar Demographics by Child Poverty Under the Age of 5

Demographics Similar to Immigrants from Spain by Child Poverty Under the Age of 5

In terms of child poverty under the age of 5, the demographic groups most similar to Immigrants from Spain are Tlingit-Haida (15.9%, a difference of 0.050%), Immigrants from North America (15.9%, a difference of 0.080%), Slovene (16.0%, a difference of 0.19%), Immigrants from Brazil (16.0%, a difference of 0.21%), and European (15.9%, a difference of 0.28%).
DemographicsRating | RankChild Poverty Under the Age of 5
Immigrants | South Africa
96.1
/100
|
#98
Exceptional
15.8%
Palestinians
95.9
/100
|
#99
Exceptional
15.8%
Immigrants | Canada
95.9
/100
|
#100
Exceptional
15.8%
Immigrants | Zimbabwe
95.9
/100
|
#101
Exceptional
15.8%
Armenians
95.7
/100
|
#102
Exceptional
15.8%
Europeans
95.3
/100
|
#103
Exceptional
15.9%
Immigrants | North America
94.9
/100
|
#104
Exceptional
15.9%
Immigrants | Spain
94.8
/100
|
#105
Exceptional
15.9%
Tlingit-Haida
94.7
/100
|
#106
Exceptional
15.9%
Slovenes
94.4
/100
|
#107
Exceptional
16.0%
Immigrants | Brazil
94.4
/100
|
#108
Exceptional
16.0%
Northern Europeans
94.3
/100
|
#109
Exceptional
16.0%
Romanians
94.3
/100
|
#110
Exceptional
16.0%
Pakistanis
94.2
/100
|
#111
Exceptional
16.0%
Peruvians
94.1
/100
|
#112
Exceptional
16.0%

Demographics Similar to Laotians by Child Poverty Under the Age of 5

In terms of child poverty under the age of 5, the demographic groups most similar to Laotians are Tsimshian (14.7%, a difference of 0.080%), Immigrants from Philippines (14.7%, a difference of 0.13%), Russian (14.8%, a difference of 0.21%), Soviet Union (14.7%, a difference of 0.26%), and Immigrants from Greece (14.7%, a difference of 0.26%).
DemographicsRating | RankChild Poverty Under the Age of 5
Eastern Europeans
99.7
/100
|
#38
Exceptional
14.6%
Norwegians
99.7
/100
|
#39
Exceptional
14.6%
Immigrants | Australia
99.7
/100
|
#40
Exceptional
14.6%
Immigrants | Belarus
99.7
/100
|
#41
Exceptional
14.7%
Soviet Union
99.7
/100
|
#42
Exceptional
14.7%
Immigrants | Greece
99.7
/100
|
#43
Exceptional
14.7%
Immigrants | Philippines
99.7
/100
|
#44
Exceptional
14.7%
Laotians
99.6
/100
|
#45
Exceptional
14.7%
Tsimshian
99.6
/100
|
#46
Exceptional
14.7%
Russians
99.6
/100
|
#47
Exceptional
14.8%
Immigrants | Czechoslovakia
99.6
/100
|
#48
Exceptional
14.8%
Immigrants | Bulgaria
99.6
/100
|
#49
Exceptional
14.8%
Immigrants | Northern Europe
99.6
/100
|
#50
Exceptional
14.8%
Estonians
99.6
/100
|
#51
Exceptional
14.8%
Immigrants | Serbia
99.5
/100
|
#52
Exceptional
14.9%